Figure 1.
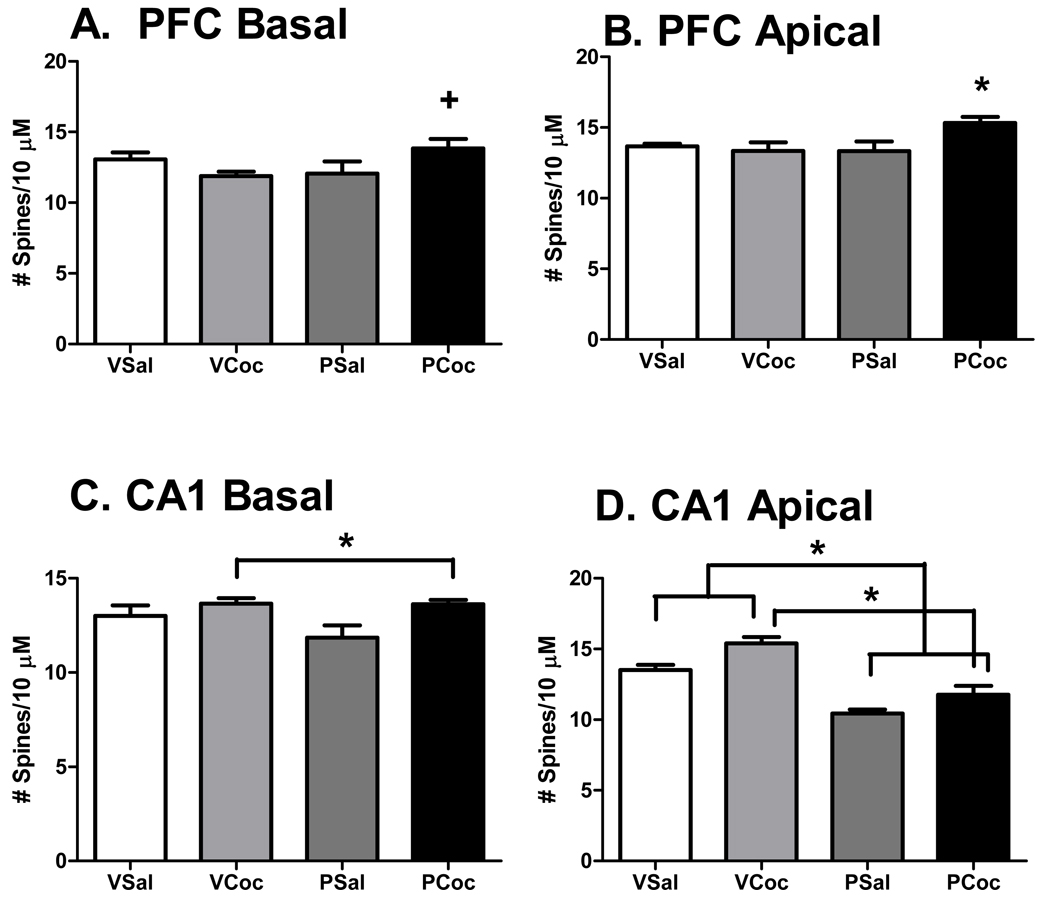
Figure 1: Effects of cocaine on spine density in the PFC and CA1. Mean ± SEM. Data analyzed by two-way ANOVA, status (virgin, pregnant) × treatment (saline, cocaine) and post hoc testing by LSD. Please see results for ANOVA outcomes.
A. PFC Basal, Significant interaction of status and treatment; +, PCoc > VCoc, p < 0.05.
B. PFC Apical, Significant interaction of status and treatment; *, PCoc > than all other groups, p < 0.05.
C. CA1 Basal, Significant effect of treatment; Coc groups > Sal groups
D. CA1 Apical, Significant effect of treatment and status; Coc groups > Sal groups, Virgin groups > pregnant groups.

