Abstract
Microdialysis studies report that systemic alcohol increases extracellular dopamine in the rat striatum. The present study examined whether changes in striatal dopamine could be detected in rats using small animal positron emission tomography (PET). PET images were acquired in 44 alcohol-naïve male Wistar and alcohol-preferring (P) rats. Subjects received up to three [11C]raclopride scans (rest, alcohol, and saline). Animals were anesthetized with isoflurane and secured on a stereotactic-like holder during all scans. Blood samples were collected from the tail or lateral saphenous vein of 12 animals 10 minutes after tracer injection for determination of blood alcohol concentration (BAC). Time activity curves were extracted from the striatum and the cerebellum and binding potential (BPND) was calculated as a measure of D2 receptor availability. Wistars given 1.0g/kg alcohol (20%v/v) I.V. or 3.0g/kg alcohol (20%v/v) I.P showed significant alcohol-induced decreases in BPND. In P rats (given 1.5, 2.25, or 3.0 g/kg alcohol), no individual group showed a statistical effect of alcohol on BPND, but taken together, all P rats receiving I.P. alcohol had significantly lower BPND than rest or saline scans. Large decreases in BPND were primarily observed in rats with BAC above 200 mg%. Also, a significant difference was found between baseline BPND of Wistars who had undergone jugular catheterization surgery for I.V. alcohol administration and those who had not. These preliminary results suggest that alcohol-induced DA release in the rat striatum is detectable using small animal PET given sufficiently large cohorts and adequate blood alcohol levels.
Keywords: binding potential, P rats, Wistars, striatum, BAC, stress, surgery
Introduction
Several microdialysis studies have reported that alcohol stimulates the release of extracellular dopamine (DA) in the nucleus accumbens of rodents (Heidbreder and De Witte, 1993; Tang et al., 2003; Yan, 1999; Yoshimoto et al., 1992). Although the mechanism behind alcohol-induced DA release has yet to be completely elucidated, DA release in the mesolimbic DA pathway, which includes projections from the ventral tegmental area to the nucleus accumbens, is believed to mediate the reinforcing properties of alcohol that can lead to alcohol abuse and dependence (Martin-Soelch et al., 2001; Volkow et al., 2009).
Microdialysis is commonly used to measure local changes in neurotransmitters in the brains of small animals, but it is invasive and damages brain tissue. In rats, decreased cerebral metabolism has been seen, via imaging, at the site of the microdialysis probe for as long as 58 days after probe implantation (Frumberg et al., 2007; Schiffer et al., 2006). Decreased neuronal activity, which accompanies decreased metabolism, might be expected to alter endogenous neurotransmitter release in these experiments. Other techniques used to measure neurotransmitter changes in the rodent brain, such as voltammetry, also require the implantation of probes (electrodes) and thus are likely subject to the same limitations as microdialysis.
Despite the increased use of positron emission tomography (PET) neuroimaging in both humans and animals, there is scant data on alcohol-induced DA release in experimental animals. Small animal PET imaging has many advantages over microdialysis and voltammetry, not the least of which is the absence of intracranial surgery and its associated risks. For instance, with PET neuroimaging animal subjects can be scanned multiple times, allowing subjects to be used as their own controls, reducing variability and thus the number of animals needed to detect statistically significant differences between treatment groups (Myers, 2001). The ability to scan a subject multiple times also permits for longitudinal analyses that are not feasible with other approaches. Small animal PET is also the only approach that allows for a direct comparison of human and animal data (Chatziioannou, 2002), since microdialysis and voltammetry cannot be done routinely in humans. With recent advances in scanner resolution and hardware, it is now time to assess whether small animal PET can be used to gather quantitative information on the release of neurotransmitters, such as DA, in the rodent brain in response to drugs of abuse, even those, such as alcohol, that are weak stimuli for DA release.
The purpose of this study was to determine whether or not alcohol-induced striatal DA release could be detected using [11C]raclopride and small animal PET. Such a finding would lay the foundation for future small animal studies to explore the DA changes in the brain that occur during alcohol abuse, as well as during withdrawal and relapse drinking. We report here our preliminary experiences with two different lines of rats, two different modes of alcohol administration, and a range of alcohol doses.
Materials and Methods
Subjects
Forty-four alcohol-naïve male rats served as subjects in this study: 17 Wistar rats and 27 alcohol-preferring (P) rats (Table 1). P rats were derived from mass selection from a foundation stock of Wistars (Li et al., 1993) and are selectively bred for alcohol preference and high voluntary consumption of alcohol (Li et al., 1979; Lumeng et al., 1977). P rats voluntarily consume 5–8 g alcohol/kg BW/day (Chester et al., 2004; Murphy et al., 1986) when given a free-choice between alcohol and water with food freely available. Rats of the P line have been found to meet all criteria of an animal model of alcoholism (Cicero, 1979; Cicero, 1980a; Cicero, 1980b; Froehlich and Li, 1991; Lester and Freed, 1973; McMillen, 1997). All rats were double or single-housed in standard cages, maintained on a 12 hour light/dark cycle and were provided with food and water ad libitum. Experimental groups are described in Table 1. All experimental procedures were approved by the Institutional Animal Care and Use Committee (IACUC) at Indiana University.
Table 1.
Experimental Rats Grouped by Strain and Alcohol Dose
| WIS-IV-1G | WIS-IP-3G | P-IP-3G | P-IP-2.25G | P-IP-1.5G | |
|---|---|---|---|---|---|
| Strain | Wistar | Wistar | P | P | P |
| Alcohol Dose | 1.0g/kg, 20%v/v | 3.0g/kg, 20%v/v | 3.0g/kg, 20%v/v | 2.25g/kg, 15%v/v | 1.5g/kg, 15%v/v |
| Delivery Mode | I.V. | I.P. | I.P. | I.P. | I.P. |
| N | 3 | 14 | 4 | 8 | 15 |
| Weight (g) | 360.6 ±9.9 | 386.7 ±32.9 | 378.6 ±22.7 | 433.0 ±52.4 | 414.3 ±46.4 |
| Injected Activity (mCi) | 0.35 ±0.3 | 0.32 ±0.06 | 0.33 ±0.04 | 0.39 ±0.05 | 0.34 ±0.04 |
| Mass Dose (nmol/kg) | 0.63 ±0.08 | 0.46 ±0.23 | 0.55 ±0.11 | 0.39 ±0.10 | 0.41 ±0.14 |
| Specific Activity at EOB (Ci/μmol) | 7.56 ±0.82 | 10.87 ±3.40 | 9.37 ±2.71 | 14.13 ±2.32 | 11.51 ±3.48 |
Values are mean ± standard deviation
Intravenous Catheterization
Jugular venous catheterization surgery was performed on 7 Wistars to provide direct access for I.V. alcohol infusion. As described previously (Chambers and Self, 2002), catheters made of surgical silastic tubing were implanted in the right jugular vein. The tubing was guided through a pocket between the muscle and subcutaneous fat over the shoulder and ended in a cannulation post (“port”) on the upper back that was housed in a cone-shaped dental acrylic mould sitting upon inert surgical mesh. After surgery, rats were individually housed and inspected daily for signs of infection at either incision site. At least 7 days were given for recovery between surgery and the first scan.
Catheters were flushed daily with 0.5 ml maintenance flush solution (bacteriostatic saline/gentomycin/heparin). Once a week, rats were injected with 0.1–0.2 ml of methohexital sodium solution to confirm catheter patency. This injection produced 5–10 seconds of anesthesia. If catheters did not function (as detected by flushing or methohexital sodium injection) and animals were healthy, a second catheterization procedure was performed on the opposite (left) internal jugular vein.
Experimental Design
Animals received up to three [11C]raclopride PET scans, each a under separate condition: rest, alcohol, or saline. All animals received rest and alcohol scans. Thirty-two of 44 animals also received saline scans (8 from WIS-IP-3G, 3 from P-IP-3G, all from P-IP-2.25G, and 13 from P-IP-1.5G). Logistical considerations prevented the remaining I.P. group animals from receiving a saline scan. None of the animals receiving an I.V. infusion of alcohol received saline scans.
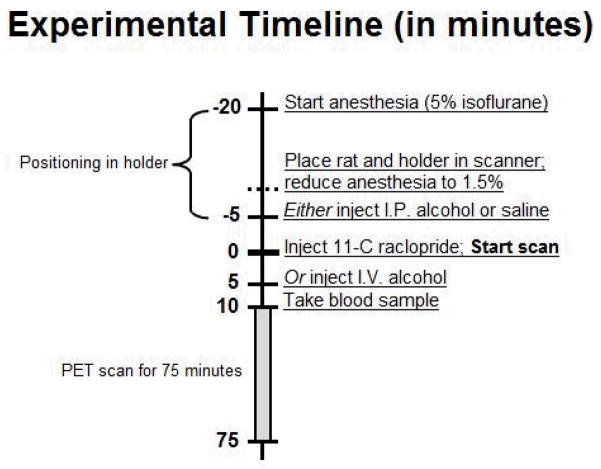
The rest condition consisted of no treatment. The alcohol condition consisted of an I.P. injection or I.V. infusion of alcohol, and the saline condition consisted of an I.P. injection of an equivalent volume of saline. I.P. injections were given 5 minutes before the start of the scan and were injected as a bolus over 1 minute. This timing was selected to ensure that peak blood alcohol concentrations (BAC) and DA release would be captured within the 75 minute scan (Engleman et al., 2008; Lumeng et al., 1982; Morris et al., 2005; Yim et al., 2000; Yoder et al., 2006; Yoshimoto et al., 1992). I.V. alcohol was administered 5 minutes after the start of the scan as a 5 minute infusion (Fig. 1). Animals were given at least 5 days to recover between scans, and the scan order was counterbalanced.
Fig. 1.
Experimental timeline. Once anesthetized, animals were secured in a stereotactic-like holder. Anesthesia was maintained for the 75 minute scan. Once the animal was secured to the holder, rat and holder were placed in the scanner and anesthesia was reduced (from 5% to 1.5% isoflurane). For alcohol scans, animals received either an I.P. injection 5 minutes before the scan started or a 5 minute I.V. infusion 5 minutes after the scan started.
Anesthesia
Prior to each scan, rats were anesthetized with 5% isoflurane in 2.5L/min O2, weighed, and secured in a stereotactic-like holder (Cheng et al., 2009). The holder was then secured to the PET scanner. This approach was used to promote good repositioning reproducibility between scans (Cheng et al., 2009; Risacher et al., 2008). Once animals were placed on the scanner, isoflurane was reduced to 1.5% and maintained at that level throughout the 75 minute scan. A 100 watt heat lamp was directed toward the animal’s torso during scanning to provide warmth.
Alcohol Injections, Doses, and Physiological Relevance
Alcohol was prepared in a solution with 0.9 % NaCl and did not exceed 20% (v/v) to avoid irritation of the peritoneum when injected I.P. (Barry and Wallgren, 1968). Alcohol was infused I.V. in a dose of 1.0 g/kg BW (20% v/v) or injected I.P. in a dose of 3.0 g/kg BW (20% v/v) in Wistars. Alcohol, or an equivalent volume of saline, was injected I.P. in a dose of either 3.0g/kg BW (20% v/v), 2.25g/kg BW (15% v/v), or 1.5 g/kg BW (15% v/v) in P rats. These doses were chosen because they are large enough to elevate BAC to 100–300 mg% in P rats (Froehlich et al., 1998; Froehlich et al., 1988), which induces intoxication (Kurtz et al., 1996), but they are still low enough to be physiologically relevant (Murphy et al., 1986).
Tracer Injection
[11C]raclopride, a D2 receptor antagonist, was synthesized as reported previously (Fei et al., 2004). Scans were initiated with a bolus injection of [11C]raclopride into the tail vein (0.34 ± 0.05 mCi, 0.44 ± 0.17 nmol/kg, specific activity of 11.45 ± 3.47 Ci/μmol at end of bombardment (EOB, ~50 minutes before time of injection)) over approximately 10 seconds. Injected volume of tracer solution in each scan was < 0.27 ml. A sufficiently low tracer mass was injected to prevent any unwanted effects of [11C]raclopride mass or a drug action (Morris et al., 1998; Schiffer et al., 2005).
Blood Sample Collection
Blood samples were collected via the tail vein or lateral saphenous vein from 12 animals to determine BAC. Approximately 500 ul of blood was collected at 10 minutes after [11C]raclopride injection (15 minutes after I.P. alcohol injection). This is the time around which BAC was expected to be at its peak (Engleman et al., 2008; Lumeng et al., 1982). Blood samples were immediately centrifuged, and the plasma was stored frozen at −20°C for later determination of BAC using an Analox Analyzer (model GL5; Analox Instruments USA, Lunenburg, MA). The alcohol concentration in 5ul samples (expressed as mg%) was determined by measuring oxygen uptake generated by the oxidation of alcohol to acetaldehyde and hydrogen peroxide by alcohol oxidase. BAC was determined in duplicate with low variability between runs; the difference between samples was less than 4%.
Imaging
All animals were scanned on an in-house small animal PET scanner (“IndyPET III”) with intrinsic spatial resolution of 1.1 mm FWHM in-plane and 1.5 mm FWHM axially, at the center of the field of view (Rouze et al., 2005). Scanner sensitivity was 4.0% of all decays. List-mode data were acquired in 3D mode and Fourier rebinned to produce stacks of 2D sinograms. Final frame times were 6 × 60, 2 × 120, and 13 × 300 seconds. Images were reconstructed with filtered back-projection with a Hanning filter (70% cutoff) to 128 × 128 × 215 images whose voxels were 0.400 mm × 0.400 mm × 0.435 mm, with the exception of 16 images whose voxels were 0.625 mm × 0.625 mm × 0.435 mm. Voxel size did not affect the ability to detect changes in BPND as a result of treatment effect. Dead time, scatter, and randoms were corrected for during reconstruction, but no attenuation correction was applied.
Data Analysis
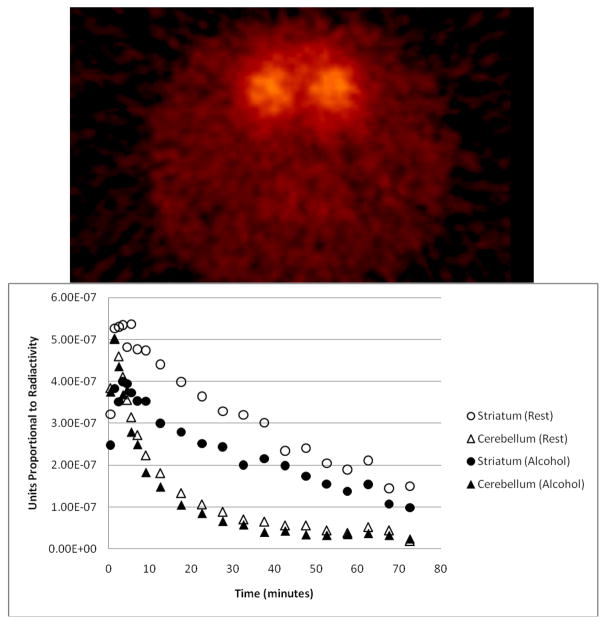
Circular ROIs (18.8 mm3 for 0.400 mm × 0.400 mm pixels and 16.3 mm3 for 0.625 mm × 0.625 mm pixels) were manually placed on 6 contiguous slices of both the left and right striatum, and an elliptical ROI (105.2 mm3 for 0.400 mm × 0.400 mm pixels and 104.0 mm3 for 0.625 mm × 0.625 mm pixels) was placed on 8 slices of the cerebellum. Average time activity curves (Fig. 2) were extracted from the aggregated ROIs and binding potential (BPND), a measure of D2 receptor availability (Innis et al., 2007), was calculated by a multi-linear reformulation of the Logan reference graphical technique (Ichise et al., 2002; Logan et al., 1996; Logan et al., 1994). BPND was calculated individually for the left and right striata, and the two values were averaged to calculate BPND of the entire striatum. Change in binding potential relative to rest ( ) was defined as , where “Condition” represented either “Alcohol” or “Saline” treatment. Note: is positive if is lower than , which is consistent with an increase in DA (i.e., DA release). “Positive ” and “decrease in BPND” are used interchangeably in the text.
Fig. 2.
(Top) Axial slice of an [11C]raclopride image of a rat brain showing left and right striata. (Bottom) Time activity curves from one animal given 3g/kg alcohol. Striatum curves shown are an average of the left and right striata. This animal received similar activity and mass doses of [11C]raclopride in each scan (rest and alcohol) and did not gain an appreciable amount of weight between scans (< 8% increase in body weight).
Statistics
Effects of scan condition (rest, alcohol, saline) were examined with repeated measures ANOVA, which directly compared BPND values across conditions within each treatment group. To test for a putative dose-dependent effect of I.P. alcohol in P rats, values for each alcohol dose (and corresponding saline control) were calculated. One-way ANOVA was used to test for treatment effects (alcohol) or group effects (saline) on . values for alcohol dose and saline treatments were tested separately (see Results). Independent t-tests were used to compare between Wistars and P rats, and between Wistars with and without surgically implanted ports. To ensure that the appropriate t-test was used, we first assessed the variances of each group with a two-sample F-test for variance. Either heteroscedastic or homoscedastic t-tests were applied as warranted. Correlation of and BAC was determined using the Pearson’s correlation coefficient. Linear regression was used to calculate R2 values and an F-test was used to determine significance of the fit. P values < 0.05 were considered significant. Statistical testing was conducted in either PASW 17.0.2 (www.spss.com) or Microsoft Excel 2007.
Results
Change in [11C]Raclopride Binding (Dopamine Release)
Effect of conditions on ΔBPND for both Wistar and P rats are given in Table 2 (see Table 1 for group abbreviations).
Table 2.
Binding Potential Changes
| (%) | (%) | |
|---|---|---|
| WIS-IV-1G | 3.21 ±0.22 | NA |
| WIS-IP-3G | 14.19 ±3.15 | −1.30 ±4.09 |
| P-IP-3G | 9.41 ±5.86 | 1.65 ±4.00 |
| P-IP-2.25G | 6.59 ±6.60 | 0.72 ±7.30 |
| P-IP-1.5G | 5.92 ±3.63 | −3.30 ±2.85 |
| All P rats | 6.63 ±2.84 | −1.34 ±2.84 |
Values are mean ± SEM,
Wistars
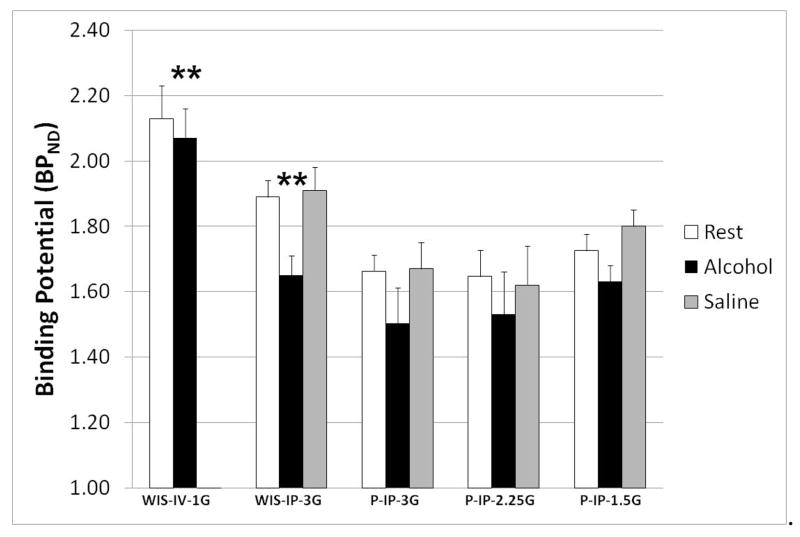
When compared with the rest condition, alcohol treatment significantly decreased BPND with both 1.0 g/kg I.V. alcohol (WIS-IV-1G) and 3.0 g/kg I.P. alcohol (WIS-IP-3G) (Fig. 3). No significant changes in BPND were seen in response to I.P. saline. No data were collected for I.V. saline treatment.
Fig. 3.
Effect of alcohol and saline injections on striatal DA concentration in Wistar and P rats. Bars are average of each group + SEM. A significant effect of alcohol was seen in WIS-IV-1G and WIS-IP-3G (**, p ≤ 0.01). Saline injection did not produce a significant in any group. No data is available for WIS-IV-1G because no saline scans were taken.
P Rats
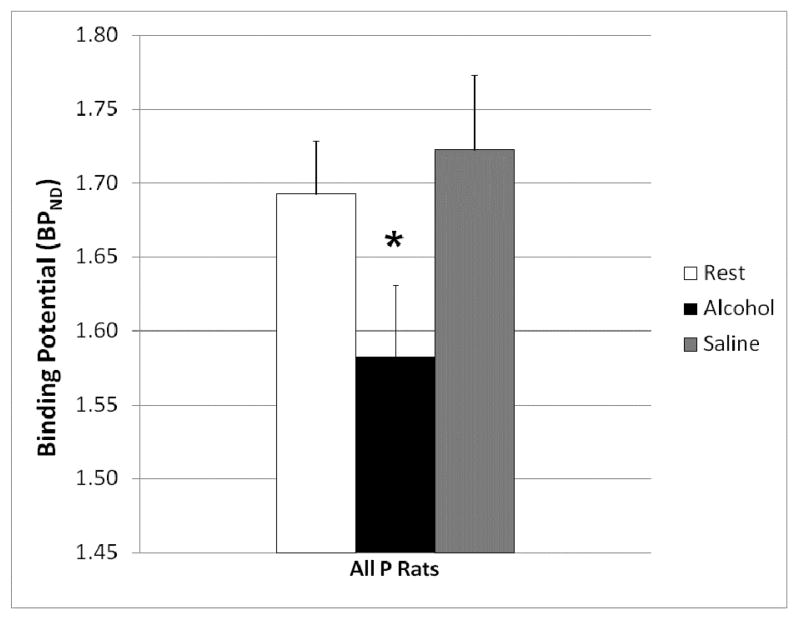
One-way ANOVA of ΔBPND values for the alcohol condition did not reveal any apparent dose-dependent effects of I.P. alcohol treatment. There were also no apparent group effects on values (i.e., no apparent volume-dependent effects of I.P. saline). Thus, data from all three I.P. alcohol treatment groups were pooled to test for treatment effects on BPND. In all P rats taken together, I.P. alcohol resulted in a significantly decreased BPND relative to the rest condition, indicative of increases in striatal DA after alcohol treatment (Fig. 4). Repeated-measures ANOVA did not reveal any effect of I.P. saline.
Fig. 4.
Effect of alcohol and saline injections on striatal DA concentration in P rats. Bars are average of all P rats regardless of alcohol dose (n = 27) + SEM. Alcohol significantly (*, p ≤ 0.05) decreased BPND.
Blood Alcohol Concentrations
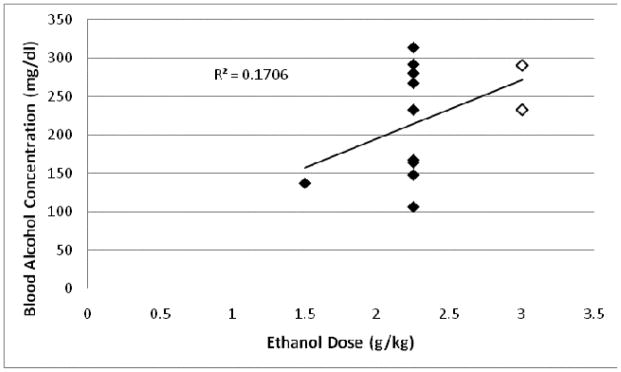
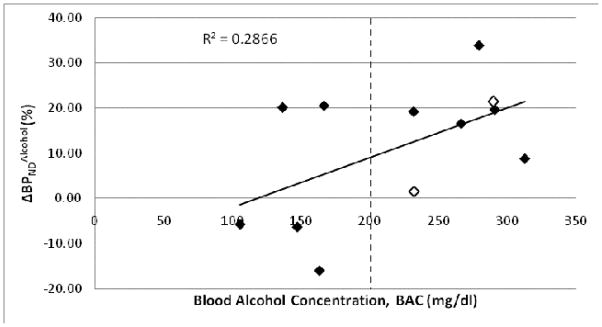
High variability was found in the BAC produced by a given dose of alcohol, e.g. 2.25g/kg alcohol I.P. yielded BAC ranging from 106–313 mg% (Fig. 5). It is worth noting, however, that higher BAC was more likely to produce a decrease in BPND (Fig. 6).
Fig. 5.
Comparison between BAC and alcohol dose in Wistar rats (n = 2, open diamonds) and P rats (n = 10, filled diamonds) given various doses of alcohol I.P. (1.5g/kg, 2.25g/kg, 3g/kg). Pearson correlation was not significant (p = 0.18).
Fig. 6.
Correlation between and BAC of Wistars (n = 2, open diamonds) and P rats (n = 10, filled diamonds) given various doses of alcohol I.P. (1.5g/kg, 2.25g/kg, 3.0g/kg). Correlation coefficient for all rats (n = 12) was 0.54 (p = 0.07).
Possible Effects of Surgery and Rat Strain
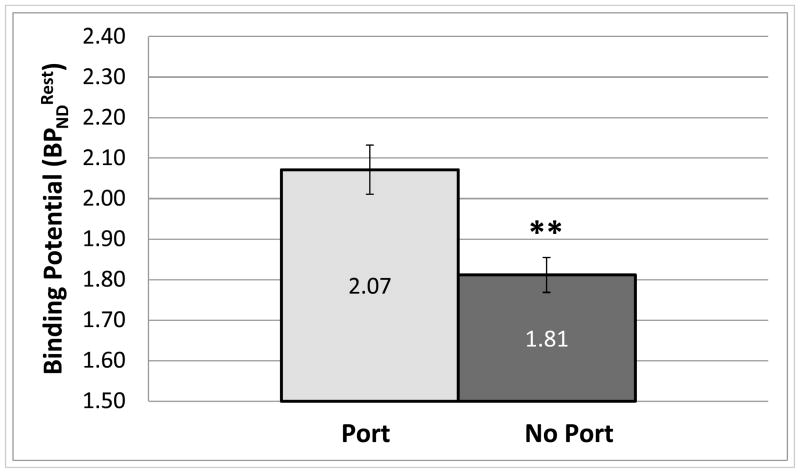
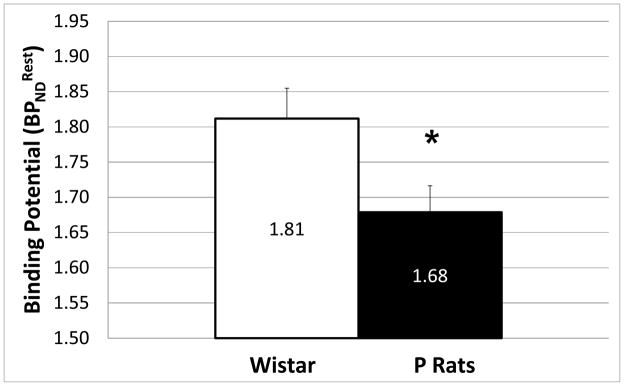
Average of Wistars with surgically implanted jugular ports was significantly (p ≤ 0.01, two-tailed, homoscedastic) higher than that of Wistars without ports (Fig. 7). Also, average of Wistars without surgically implanted jugular ports was higher (p ≤ 0.05, two-tailed homoscedastic) than that of P rats (Fig. 8).
Fig. 7.
Comparison of average rest BPND for (Wistars) with surgically implanted ports (n = 7) and (Wistars) without ports (n = 11). Error bars are SEM (**, p ≤ 0.01, two-tailed homoscedastic t-test).
Fig. 8.
Comparison of average rest BPND for Wistars (n = 11) and P rats (n = 28). Error bars are SEM (*, p ≤ 0.05, two-tailed homoscedastic t-test).
Discussion
Using small animal PET, we have shown that it is possible to detect a statistically significant decrease in [11C]raclopride BPND in the rat striatum following I.P. or I.V. alcohol treatment. We infer this decrease in BPND to reflect increase in striatal DA. The largest and most significant increase in DA concentration ( ) was seen in Wistars (n = 14) given 3.0 g/kg I.P. alcohol. It should also be noted that while significant decreases in BPND were found with 1.0 g/kg I.V. alcohol, the cohort was small (n = 3) and thus the results are highly preliminary but encouraging. We found no statistical effect of I.P. alcohol dose on . It is likely that larger cohorts would be necessary to examine dose dependent effects of alcohol on BPND.
Complications in collecting blood from the tail vein prevented us from measuring BAC in all animals. To circumvent the problems related to tail vein sampling, we collected blood samples from the lateral saphenous vein in some animals. Regardless of which vein was used, it was difficult to collect blood. Under anesthesia and alcohol administration blood pressure appeared to decrease and blood viscosity appeared to increase (based on visual observation). From the blood samples available, we found a positive correlation between and BAC. There was also high variability in BAC measured at the 2.25g/kg alcohol dose. This variability may reflect errors in the actual alcohol content of the injected solution or errors in the I.P. injection. Though steps were taken to insure that both of these procedures were carried-out correctly, we cannot rule them out as sources of variability. Six out of the 7 animals with BAC>200mg% showed greater than 8% (i.e. increase in DA concentration). Notwithstanding the high degree of variability in BAC produced by a given alcohol dose, this data may suggest that BAC needs to be greater than 200mg% to reliably produce a detectable increase in DA concentration under the present imaging protocol.
As stated above, alcohol-preferring (P) rats are an established animal model of alcoholism. P rats’ increased predilection to consume alcohol is thought to be due, in part, to lower basal DA concentrations (Murphy et al., 1982) and to increased DA release in the striatum in response to alcohol (Weiss et al., 1993). Free-choice drinking studies have shown that alcohol induces significantly greater DA release in P rats than in Wistars (Weiss et al., 1993). Similarly, I.P. administration of alcohol results in greater striatal DA release (measured by microdialysis) in an alcohol preferring rat line compared with an alcohol abstaining line (University of Chile bibulous vs. Abstainer rats) (Bustamante et al., 2008). Thus, we expected that P rats would exhibit a greater DA response to alcohol (greater ) than Wistars. This was not observed (Fig. 3). However, given the limited size of the P-IP-3G group (n = 4), it was not possible to make a definitive comparison between them and the comparably treated Wistars (WIS-IP-3G).
We did find that P rats had lower resting [11C]raclopride binding potential ( ) than Wistars. Autoradiographic studies have shown that P rats have lower striatal D2 receptor densities than alcohol non-preferring (NP) rats (McBride et al., 1993), and recent imaging studies have shown the P rats have lower resting [11C]raclopride binding potential than NP rats (Thanos et al., 2004). If we assume that the non-displaceable tissue free fraction (fP) and disassociation constant (KD) of [11C]raclopride for D2 receptors are the same across lines, we can interpret [11C]raclopride (where , (Innis et al., 2007)) as a measure of D2 receptor density (Bavail). Because Ps and NPs are based on Wistars, one might speculate that through selective breeding P rats have acquired lower D2 receptor density than Wistars. Thus, our findings are consistent with both the work of Thanos et al. and McBride et al.
In the present study, almost all P rats were given lower doses of alcohol than Wistars because, in our hands, P rats were prone to fatal overdose by the combination of anesthesia and high dose alcohol. Anesthesia induction in P rats was variable. Unlike Wistars, for whom full anesthesia was consistently induced with 5% isoflurane, some P rats would fluctuate between consciousness and unconsciousness repeatedly prior to imaging. Additionally, it was considerably more difficult to locate the tail vein for tracer injections in P rats than in Wistar rats. This may be due to lower resting blood pressure in P rats, as has been reported in another line of alcohol-preferring rats (AA) compared to their alcohol-avoiding counterparts (ANA) (Linkola et al., 1980). Consistent with the literature, P rats were apparently less sensitive to the central depressant effects of alcohol relative to Wistars (Kurtz et al., 1996; Lumeng et al., 1982). P rats tended to regain motor control and normal behavior sooner than Wistars after administration of comparable doses of alcohol and anesthesia.
Isoflurane was chosen for these studies because it is easy to provide and, as a gas, easily used to maintain anesthesia throughout the scan. No difference has been shown in [11C]raclopride binding between awake and isoflurane anesthetized monkeys (Tsukada et al., 2002), but several studies have shown that isoflurane effects the DA system. In rats, isoflurane and halothane (at similar doses to what was used in here) have been found to decrease extracellular DA and increase DA metabolites (Adachi et al., 2000; Adachi et al., 2005). In our studies, this would result in an attenuation of the effect of alcohol on BPND. A more concerning confound would be if isoflurane enhanced the decrease in BPND due to alcohol, as has been seen in monkeys with nicotine and methamphetamine (Tsukada et al., 2002). Given this, we cannot discount that isoflurane may have had an effect on the DA system of the animals we were studying.
No attenuation correction was applied to the scans in this study. Given that all scans for each animal were completed within a short time frame (3–4 weeks, reducing animal growth as a confounding factor), we do not believe that lack of attenuation correction negatively affected our analysis. Furthermore, our semi-stereotactic holder (made of acrylic plastic, which has a low linear attenuation coefficient) provided highly reproducible repositioning, making attenuation effects negligible (Cheng et al., 2009).
Injection of an equal volume of saline was used in the current study to control for the stress associated with I.P. injection. Although the mesolimbic DA system has been shown to be involved in perception of pain and response to noxious stimuli in both awake and anesthetized animals (Gear et al., 1999; Schultz and Romo, 1987; Ungless et al., 2004), data from the saline scans indicated that there was no significant effect of I.P. injection of inert fluid on BPND. This supports our conclusions that the observed decreases in BPND (increased DA) were primarily due to the pharmacological effects of alcohol.
Seven Wistars were implanted with jugular catheters for I.V. infusion of alcohol. Problems maintaining catheter patency reduced the usefulness of this approach; only 3 of the 7 animals implanted were patent for I.V. infusions (WIS-IV-1G). Nevertheless, this study design provided an opportunity to assess the effect of surgical cannula implantation on striatal DA concentration. Wistars with implanted ports had significantly higher than those without ports. Although animals with ports did not exhibit signs of pain during the course of the study (e.g. self-mutilation, loss of appetite), our findings may reflect the effect of increased stress on D2 receptor density or basal DA level. Rats with ports were housed singly after surgery and during the PET scan experiments (~3 weeks for the duration of experiments), which may have introduced isolation stress. It is possible that chronic, low-level stress increases (i.e. D2 receptor availability), either through a reduction in basal DA concentration (Gambarana et al., 1999) or through up-regulation of D2 receptor density (Lucas et al., 2007). The suggestion that standard housing and surgery could affect BPND is relevant to future experiment design and warrants further investigation.
In summary, we were able to detect alcohol-induced changes in [11C]raclopride BPND in the striatum of anesthetized Wistar and P rats using small animal PET and feel confident that these observed changes reflect the effects of alcohol on DA release in the rat striatum. Our results suggest that achieving threshold BAC may be necessary to provoke DA release that is measurable with PET. We also detected differences in basal D2 receptor availability between Wistar and P rats and observed what may be an effect of chronic stress on D2 receptor availability in Wistars. Further work is needed with larger cohorts to confirm the ability to image DA release in P rats. A full comparison of modes of alcohol delivery (I.V. vs. I.P.) and their effect on PET imaging of alcohol-induced DA release would be useful. Additional work must also address what ranges of alcohol dose are physiologically relevant and likely to produce adequate BAC to realize a consistently detectable .
Acknowledgments
We’d like to thank our colleagues Sarah Berg and Dr. Andrew Chambers for animal surgeries and consequent care, as well as Dr. Sandra Morzorati for blood sample analyses. This work was supported by P60 AA007611 (National Institutes of Health/National Institute on Alcohol Abuse and Alcoholism, to Crabb), R21 AA015077 (National Institutes of Health/National Institute on Alcohol Abuse and Alcoholism, to Morris), Purdue Ross Fellowship (2007–2008, to Sullivan), Shared University Research grants from IBM, Inc. to Indiana University, and the National Science Foundation under Grant No. CNS-0521433.
References
- Adachi Y, Uchihashi Y, Watanabe K, Satoh T. Halothane anesthesia decreases the extracellular level of dopamine in rat striatum: a microdialysis study in vivo. J Anesth. 2000;14(2):82–90. doi: 10.1007/s005400050072. [DOI] [PubMed] [Google Scholar]
- Adachi YU, Yamada S, Satomoto M, Higuchi H, Watanabe K, Kazama T. Isoflurane anesthesia induces biphasic effect on dopamine release in the rat striatum. Brain Res Bull. 2005;67(3):176–181. doi: 10.1016/j.brainresbull.2005.06.020. [DOI] [PubMed] [Google Scholar]
- Barry H, Wallgren H. Further Note on Preparing Alcohol Solutions. Quarterly Journal of Studies on Alcohol. 1968;29(1):176–178. [Google Scholar]
- Bustamante D, Quintanilla ME, Tampier L, Gonzalez-Lira V, Israel Y, Herrera-Marschitz M. Ethanol induces stronger dopamine release in nucleus accumbens (shell) of alcohol-preferring (bibulous) than in alcohol-avoiding (abstainer) rats. European Journal of Pharmacology. 2008;591(1–3):153–158. doi: 10.1016/j.ejphar.2008.06.069. [DOI] [PMC free article] [PubMed] [Google Scholar]
- Chambers R, Self D. Motivational responses to natural and drug rewards in rats with neonatal ventral hippocampal lesions: an animal model of dual diagnosis schizophrenia. Neuropsychopharmacology. 2002;27(6):889–905. doi: 10.1016/S0893-133X(02)00365-2. [DOI] [PMC free article] [PubMed] [Google Scholar]
- Chatziioannou AF. Molecular imaging of small animals with dedicated PET tomographs. Eur J Nucl Med Mol Imaging. 2002;29(1):98–114. doi: 10.1007/s00259-001-0683-3. [DOI] [PubMed] [Google Scholar]
- Cheng TE, Yoder KK, Normandin MD, Risacher SL, Converse AK, Hampel JA, Miller MA, Morris ED. A rat head holder for simultaneous scanning of two rats in small animal PET scanners: Design, construction, feasibility testing and kinetic validation. Journal of Neuroscience Methods. 2009;176(1):24–33. doi: 10.1016/j.jneumeth.2008.08.031. [DOI] [PMC free article] [PubMed] [Google Scholar]
- Chester JA, Blose AM, Zweifel M, Froehlich JC. Effects of stress on alcohol consumption in rats selectively bred for high or low alcohol drinking. Alcoholism. 2004;28(3):385–393. doi: 10.1097/01.alc.0000117830.54371.7a. [DOI] [PubMed] [Google Scholar]
- Cicero TJ. A critique of animal analogues of alcoholism. In: Majchrowicz E, Noble EP, editors. Biochemistry and Pharmacology of Ethanol. New York: Plenum Press; 1979. pp. 533–560. [Google Scholar]
- Cicero TJ. Alcohol self-administration, tolerance and withdrawal in humans and animals: theoretical and methodological issues. In: Rigter H, Crabbe JC, editors. Alcohol tolerance and dependence. New York: Elsevier; 1980a. pp. 1–51. [Google Scholar]
- Cicero TJ. Animal models of alcoholism? In: Eriksson K, Sinclair JD, Kiianmaa K, editors. Animal Models in Alcohol Research. New York: Plenum Press; 1980b. pp. 99–117. [Google Scholar]
- Engleman EA, Ingraham CM, Franklin KM, Keith CM, McClaren JA, Schultz JA, Morzorati SL, O’Connor S, Thielen RJ, Murphy JM, McBride WJ. In Vivo Time-Course Changes in Ethanol Levels Sampled With Subcutaneous Microdialysis. Alcoholism: Clinical and Experimental Research. 2008;32(3):435–442. doi: 10.1111/j.1530-0277.2007.00587.x. [DOI] [PubMed] [Google Scholar]
- Fei X, Mock BH, DeGrado TR, Wang J-Q, Glick-Wilson BE, Sullivan ML, Hutchins GD, Zheng Q-H. An Improved Synthesis of PET Dopamine D2 Receptors Radioligand [11C]Raclopride. Synthetic Communications. 2004;34(10):1897–1907. [Google Scholar]
- Froehlich JC, Badia-Elder NE, Zink RW, McCullough DE, Portoghese PS. Contribution of the opioid system to alcohol aversion and alcohol drinking behavior. J Pharmacol Exp Ther. 1998;287(1):284–292. [PubMed] [Google Scholar]
- Froehlich JC, Harts J, Lumeng L, Li TK. Differences in response to the aversive properties of ethanol in rats selectively bred for oral ethanol preference. Pharmacol Biochem Behav. 1988;31(1):215–222. doi: 10.1016/0091-3057(88)90336-x. [DOI] [PubMed] [Google Scholar]
- Froehlich JC, Li TK. Animal models for the study of alcoholism: utility of selected lines. J Addict Dis. 1991;10(1–2):61–71. doi: 10.1300/J069v10n01_05. [DOI] [PubMed] [Google Scholar]
- Frumberg DB, Fernando MS, Lee DE, Biegon A, Schiffer WK. Metabolic and behavioral deficits following a routine surgical procedure in rats. Brain Res. 2007;1144:209–218. doi: 10.1016/j.brainres.2007.01.134. [DOI] [PMC free article] [PubMed] [Google Scholar]
- Gambarana C, Masi F, Tagliamonte A, Scheggi S, Ghiglieri O, Montis MGD. A Chronic Stress that Impairs Reactivity in Rats Also Decreases Dopaminergic Transmission in the Nucleus Accumbens: A Microdialysis Study. Journal of Neurochemistry. 1999;72(5):2039–2046. doi: 10.1046/j.1471-4159.1999.0722039.x. [DOI] [PubMed] [Google Scholar]
- Gear RW, Aley KO, Levine JD. Pain-Induced Analgesia Mediated by Mesolimbic Reward Circuits. Journal of Neuroscience. 1999;19(16):7175–7181. doi: 10.1523/JNEUROSCI.19-16-07175.1999. [DOI] [PMC free article] [PubMed] [Google Scholar]
- Heidbreder C, De Witte P. Ethanol differentially affects extracellular monoamines and GABA in the nucleus accumbens. Pharmacology Biochemistry and Behavior. 1993;46(2):477–481. doi: 10.1016/0091-3057(93)90383-5. [DOI] [PubMed] [Google Scholar]
- Ichise M, Toyama H, Innis RB, Carson RE. Strategies to improve neuroreceptor parameter estimation by linear regression analysis. J Cereb Blood Flow Metab. 2002;22(10):1271–1281. doi: 10.1097/01.WCB.0000038000.34930.4E. [DOI] [PubMed] [Google Scholar]
- Innis RB, Cunningham VJ, Delforge J, Fujita M, Gjedde A, Gunn RN, Holden J, Houle S, Huang SC, Ichise M, Iida H, Ito H, Kimura Y, Koeppe RA, Knudsen GM, Knuuti J, Lammertsma AA, Laruelle M, Logan J, Maguire RP, Mintun MA, Morris ED, Parsey R, Price JC, Slifstein M, Sossi V, Suhara T, Votaw JR, Wong DF, Carson RE. Consensus nomenclature for in vivo imaging of reversibly binding radioligands. J Cereb Blood Flow Metab. 2007;27(9):1533–1539. doi: 10.1038/sj.jcbfm.9600493. [DOI] [PubMed] [Google Scholar]
- Kurtz DL, Stewart RB, Zweifel M, Li TK, Froehlich JC. Genetic differences in tolerance and sensitization to the sedative/hypnotic effects of alcohol. Pharmacology Biochemistry and Behavior. 1996;53(3):585–591. doi: 10.1016/0091-3057(95)02055-1. [DOI] [PubMed] [Google Scholar]
- Lester D, Freed EX. Criteria for an animal model of alcoholism. Pharmacol Biochem Behav. 1973;1:103–107. doi: 10.1016/0091-3057(73)90062-2. [DOI] [PubMed] [Google Scholar]
- Li T-K, Lumeng L, Doolittle DP. Selective breeding for alcohol preference and associated responses. Behavior Genetics. 1993;23:163–170. doi: 10.1007/BF01067421. [DOI] [PubMed] [Google Scholar]
- Li TK, Lumeng L, McBride WJ, Waller MB, Hawkins TD. Progress toward a voluntary oral consumption model of alcoholism. Drug and Alcohol Dependence. 1979;4(1–2):43–43. doi: 10.1016/0376-8716(79)90040-1. [DOI] [PubMed] [Google Scholar]
- Linkola J, Tikkanen I, Fyhrquist F, Rusi M. Renin, Water drinking, salt preference and blood pressure in alcohol preferring and alcohol avoiding rats. Pharmacology Biochemistry and Behavior. 1980;12(2):293–296. doi: 10.1016/0091-3057(80)90371-8. [DOI] [PubMed] [Google Scholar]
- Logan J, Fowler JS, Volkow ND, Wang GJ, Ding YS, Alexoff DL. Distribution volume ratios without blood sampling from graphical analysis of PET data. J Cereb Blood Flow Metab. 1996;16(5):834–840. doi: 10.1097/00004647-199609000-00008. [DOI] [PubMed] [Google Scholar]
- Logan J, Volkow ND, Fowler JS, Wang GJ, Dewey SL, MacGregor R, Schlyer D, Gatley SJ, Pappas N, King P, et al. Effects of blood flow on [11C]raclopride binding in the brain: model simulations and kinetic analysis of PET data. J Cereb Blood Flow Metab. 1994;14(6):995–1010. doi: 10.1038/jcbfm.1994.132. [DOI] [PubMed] [Google Scholar]
- Lucas LR, Wang C-J, McCall TJ, McEwen BS. Effects of immobilization stress on neurochemical markers in the motivational system of the male rat. Brain Research. 2007;1155:108–115. doi: 10.1016/j.brainres.2007.04.063. [DOI] [PMC free article] [PubMed] [Google Scholar]
- Lumeng L, Hawkins TD, Li TK. New strains of rats with alcohol preference and nonpreference. In: Thurman R, Williamson J, Drott H, Chance B, editors. Alcohol and Aldehyde Metabolizing Systems. New York: Academic Press; 1977. pp. 537–544. [Google Scholar]
- Lumeng L, Waller MB, McBride WJ, Ting-Kai L. Different sensitivities to ethanol in alcohol-preferring and -nonpreferring rats. Pharmacology Biochemistry and Behavior. 1982;16(1):125–130. doi: 10.1016/0091-3057(82)90023-5. [DOI] [PubMed] [Google Scholar]
- Martin-Soelch C, Leenders KL, Chevalley AF, Missimer J, Künig G, Magyar S, Mino A, Schultz W. Reward mechanisms in the brain and their role in dependence: evidence from neurophysiological and neuroimaging studies. Brain Research Reviews. 2001;36(2–3):139–149. doi: 10.1016/s0165-0173(01)00089-3. [DOI] [PubMed] [Google Scholar]
- McBride WJ, Chernet E, Dyr W, Lumeng L, Li TK. Densities of dopamine D2 receptors are reduced in CNS regions of alcohol-preferring P rats. Alcohol. 1993;10(5):387–390. doi: 10.1016/0741-8329(93)90025-j. [DOI] [PubMed] [Google Scholar]
- McMillen B. Toward a definition of a valid model of alcoholism: Multiple animals models for multiple diseases. Alcohol. 1997;14:409–419. doi: 10.1016/s0741-8329(97)90012-4. [DOI] [PubMed] [Google Scholar]
- Morris ED, Chefer SI, London ED. Limitations of Binding Potential as a Measure of Receptor Function. A Two-Point Correction for the Effects of Mass. In: Carson RE, Daube-Witherspoon ME, Herscovitch P, editors. Quantitative Functional Brain Imaging with Positron Emission Tomography. Academic Press; 1998. pp. 407–414. [Google Scholar]
- Morris ED, Yoder KK, Wang C, Normandin MD, Zheng QH, Mock B, Muzic RF, Jr, Froehlich JC. ntPET: a new application of PET imaging for characterizing the kinetics of endogenous neurotransmitter release. Mol Imaging. 2005;4(4):473–489. doi: 10.2310/7290.2005.05130. [DOI] [PubMed] [Google Scholar]
- Murphy JM, Gatto GJ, Waller MB, McBride WJ, Lumeng L, Li TK. Effects of scheduled access on ethanol intake by the alcohol-preferring (P) line of rats. Alcohol. 1986;3:331–336. doi: 10.1016/0741-8329(86)90010-8. [DOI] [PubMed] [Google Scholar]
- Murphy JM, McBride WJ, Lumeng L, Li TK. Regional brain levels of monoamines in alcohol-preferring and -nonpreferring lines of rats. Pharmacology Biochemistry and Behavior. 1982;16(1):145–149. doi: 10.1016/0091-3057(82)90026-0. [DOI] [PubMed] [Google Scholar]
- Myers R. The biological application of small animal PET imaging. Nuclear Medicine and Biology. 2001;28(5):585–593. doi: 10.1016/s0969-8051(01)00213-x. [DOI] [PubMed] [Google Scholar]
- Risacher S, Sullivan J, Normandin M, Cheng TE, Morris E. Positional repeatability of rat stereotactic head holder for small animal PET studies. J NUCL MED MEETING ABSTRACTS. 2008;49:402P-b. (MeetingAbstracts_1) [Google Scholar]
- Rouze NC, Soon VC, Young JW, Siegel S, Hutchins GD. Initial evaluation of the Indiana small animal PET scanner. 2005. pp. 2394–2398. [Google Scholar]
- Schiffer WK, Alexoff DL, Shea C, Logan J, Dewey SL. Development of a simultaneous PET/microdialysis method to identify the optimal dose of 11C-raclopride for small animal imaging. Journal of Neuroscience Methods. 2005;144(1):25–34. doi: 10.1016/j.jneumeth.2004.10.016. [DOI] [PMC free article] [PubMed] [Google Scholar]
- Schiffer WK, Mirrione MM, Biegon A, Alexoff DL, Patel V, Dewey SL. Serial microPET measures of the metabolic reaction to a microdialysis probe implant. J Neurosci Methods. 2006;155(2):272–284. doi: 10.1016/j.jneumeth.2006.01.027. [DOI] [PubMed] [Google Scholar]
- Schultz W, Romo R. Responses of nigrostriatal dopamine neurons to high-intensity somatosensory stimulation in the anesthetized monkey. Journal of Neurophysiology. 1987;57(1):201–217. doi: 10.1152/jn.1987.57.1.201. [DOI] [PubMed] [Google Scholar]
- Tang A, George MA, Randall JA, Gonzales RA. Ethanol Increases Extracellular Dopamine Concentration in the Ventral Striatum in C57BL/6 Mice. Alcoholism: Clinical and Experimental Research. 2003;27(7):1083–1089. doi: 10.1097/01.ALC.0000075825.14331.65. [DOI] [PubMed] [Google Scholar]
- Thanos PK, Nicholas BT, Seth NR, Hiroyuki U, Hiroyuki I, George R, Donald KI, Robert H, Joanna SF, Gatley SJ, Gene-Jack W, Nora DV. DRD2 Gene Transfer Into the Nucleus Accumbens Core of the Alcohol Preferring and Nonpreferring Rats Attenuates Alcohol Drinking. Alcoholism: Clinical and Experimental Research. 2004;28(5):720–728. doi: 10.1097/01.alc.0000125270.30501.08. [DOI] [PubMed] [Google Scholar]
- Tsukada H, Miyasato K, Kakiuchi T, Nishiyama S, Harada N, Domino EF. Comparative effects of methamphetamine and nicotine on the striatal [(11)C]raclopride binding in unanesthetized monkeys. Synapse. 2002;45(4):207–212. doi: 10.1002/syn.10102. [DOI] [PubMed] [Google Scholar]
- Ungless MA, Magill PJ, Bolam JP. Uniform Inhibition of Dopamine Neurons in the Ventral Tegmental Area by Aversive Stimuli. Science. 2004;303(5666):2040–2042. doi: 10.1126/science.1093360. [DOI] [PubMed] [Google Scholar]
- Volkow ND, Fowler JS, Wang GJ, Baler R, Telang F. Imaging dopamine’s role in drug abuse and addiction. Neuropharmacology. 2009;56(Supplement 1):3–8. doi: 10.1016/j.neuropharm.2008.05.022. [DOI] [PMC free article] [PubMed] [Google Scholar]
- Weiss F, Lorang MT, Bloom FE, Koob GF. Oral alcohol self-administration stimulates dopamine release in the rat nucleus accumbens: genetic and motivational determinants. Journal of Pharmacology and Experimental Therapeutics. 1993;267(1):250–258. [PubMed] [Google Scholar]
- Yan Q-S. Extracellular Dopamine and Serotonin After Ethanol Monitored With 5-Minute Microdialysis. Alcohol. 1999;19(1):1–7. doi: 10.1016/s0741-8329(99)00006-3. [DOI] [PubMed] [Google Scholar]
- Yim HJ, Robinson DL, White ML, Jaworski JN, Randall PK, Lancaster FE, Gonzales RA. Dissociation Between the Time Course of Ethanol and Extracellular Dopamine Concentrations in the Nucleus Accumbens After a Single Intraperitoneal Injection. Alcoholism: Clinical and Experimental Research. 2000;24(6):781–788. [PubMed] [Google Scholar]
- Yoder K, Normandin M, Morris E. Preliminary study of alcohol-induced dopamine release in rats with [11C]raclopride. J NUCL MED MEETING ABSTRACTS. 2006;47(suppl_1):277. [Google Scholar]
- Yoshimoto K, McBride WJ, Lumeng L, Li TK. Alcohol stimulates the release of dopamine and serotonin in the nucleus accumbens. Alcohol. 1992;9(1):17–22. doi: 10.1016/0741-8329(92)90004-t. [DOI] [PubMed] [Google Scholar]


