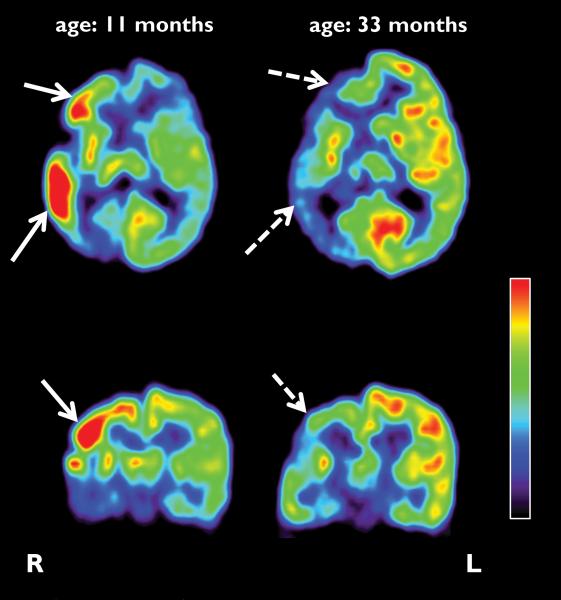
Figure 1.
Representative axial and coronal images of initial and follow-up FDG PET scans of a child (patient #5) with Sturge-Weber syndrome and epilepsy. The first scan was performed at the age of 11 months and showed increased glucose metabolism in the right frontal, temporal and parietal lobes of the right hemisphere (solid arrows), in addition to hypometabolism in the posterior parieto-temporal and occipital cortex. The second FDG PET scan, performed 2 years later, demonstrated a switch to hypometabolism in the corresponding areas (dashed arrows). L: left; R: right.

