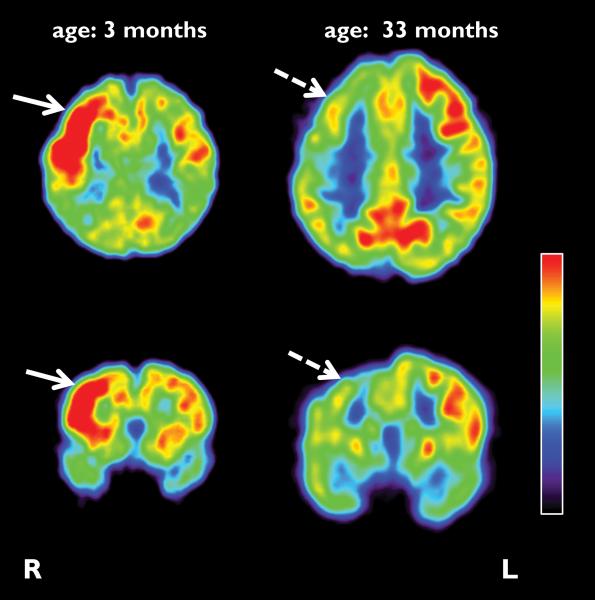
Figure 2.
Representative axial and coronal sections of initial and follow-up FDG PET scans of an infant (patient #1) with Sturge-Weber syndrome. The initial scan was done at the age of 3 months, 2 months before the onset of first seizures, and depicted increased glucose uptake in the right hemisphere, predominantly in the frontal cortex (solid arrow). The follow-up PET scan was performed 2.5 years after the initial scan, and showed an interval switch of glucose hypermetabolism to hypometabolism (dashed arrows).

