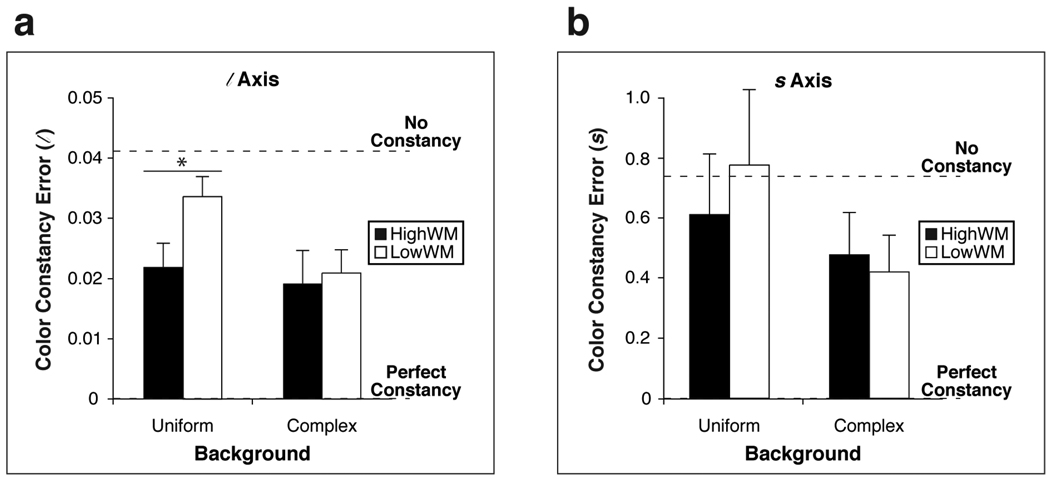
Figure 2.
Color constancy errors averaged across test colors for (a) the l axis and (b) the s axis. Results are separated by background condition (uniform and complex). Black [white] bars indicate values for HWM [LWM] participants. The vertical axis indicates the color constancy error, calculated for each test illuminant as the absolute value of the difference between the color settings made when the training illuminant was the same as the test illuminant, and when it was different (and then averaged across test illuminants). A smaller value indicates a smaller effect of the training illuminant, and thus better color constancy. “Perfect constancy” refers to a color constancy error of 0. “No constancy” refers to a color constancy error equal in magnitude to the shift in chromaticity of the (averaged) test color under a change in illuminants. A value larger than this indicates a color constancy error that is even greater in magnitude than this shift in chromaticity of the test color. Error bars indicate standard errors of the mean. An asterisk indicates significance at the p < 0.05 level.

