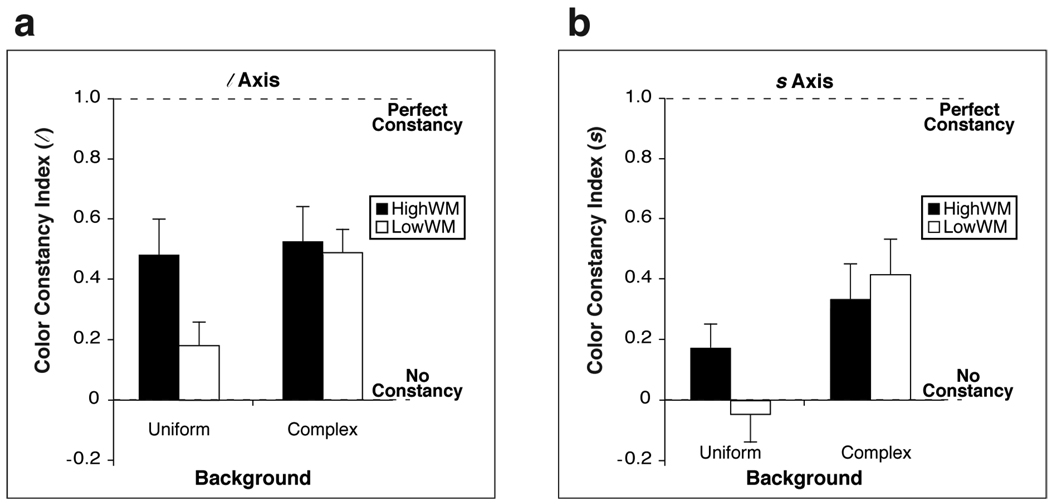
Figure 3.
Color constancy index values averaged across test colors for (a) the l axis and (b) the s axis. Results are separated by background condition (uniform and complex). Black [white] bars indicate values for HWM [LWM] participants. The vertical axis indicates the value of the color constancy index. A larger value indicates better color constancy. “Perfect constancy” refers to a color constancy index of 1. “No constancy” refers to a color constancy index of 0. A negative value is possible if the corresponding color constancy error is greater in magnitude than the shift in chromaticity of the test color under a change in illuminants (see Figure 2). Error bars indicate standard errors of the mean.

