
Figure 1.
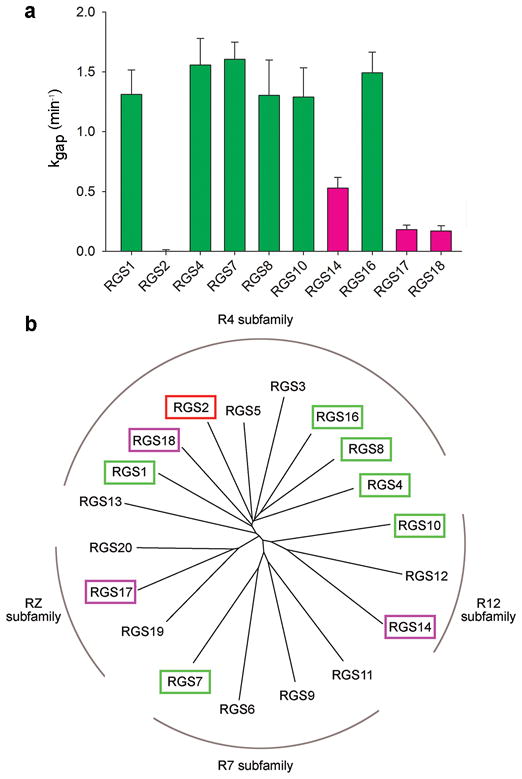
The GAP activities of 10 representative RGS domains do not correlate with their sub-family classification. (a) The kgap constant for each domain was calculated as described in Supplementary Methods from single exponential fits to the time course of GTP hydrolyzed by Gαo (400 nM) with or without added RGS protein (20 nM). The data are shown as mean±s.e.m; n≥4. High-activity, low-activity, and no-activity RGS proteins are colored green, magenta, and red, respectively. (b) Phylogenetic tree of 20 human RGS domains. RGS proteins whose activity was tested in this study are colored as in a.