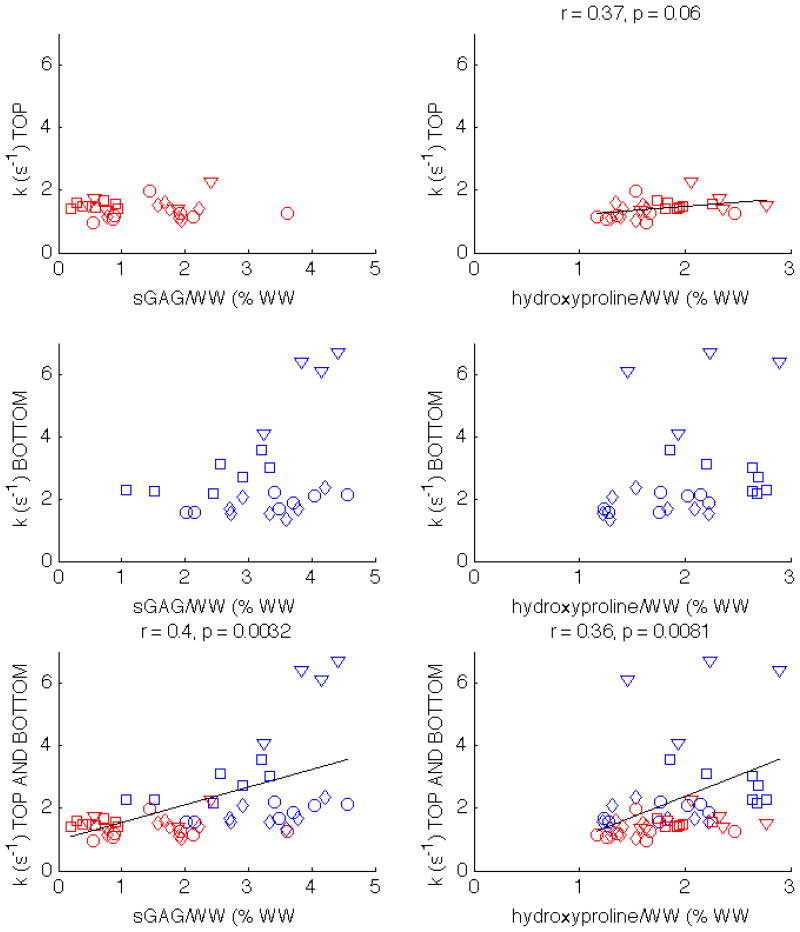
Figure 6.
Scatter plots showing the correlations of k with sGAG/WW and hydroxyproline/WW in patella 1 (circles), patella 2 (squares), patella 3 (diamonds), and tibia (triangles). The correlations with statistical significance are displayed above the corresponding subplot. k correlates with hydroxyproline/WW when only the top half plugs are considered, as well as when both top and bottom halves are analyzed together.

