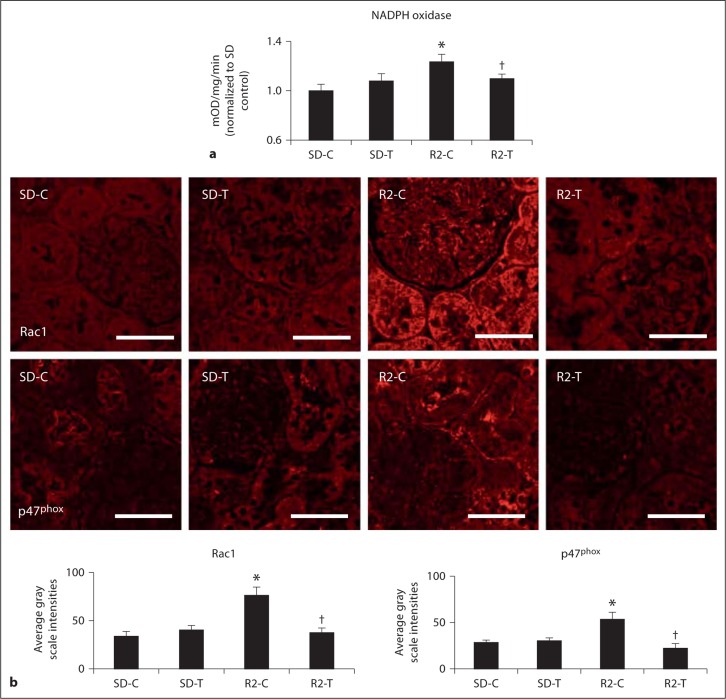
Fig. 2.
Angiotensin II activation of PTC NADPH oxidase. a Total NADPH oxidase activity. b Depicts representative images of semi-quantitative immunohistochemistry analysis and localization of NADPH oxidase subunits Rac1 and p47phox to the PT with corresponding measures of intensity below. * p < 0.05 when compared to age-matched Sprague-Dawley controls (SD-C); † p < 0.05 when telmisartan-treated R2 rats (R2-T) are compared to age-matched Ren2 controls (R2-C). Scale bar = 50 μm.

