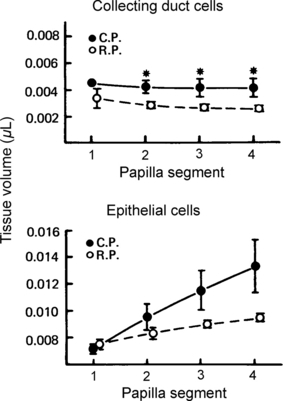
Figure 10.

Computed volumes of the various structures in papillae stopped and fixed in the contracted phase (CP) and the relaxed phase (RP). The volumes are calculated in segments representing the volume between two papillary cross sections containing the following numbers of collecting ducts: #1, 5–10; #2, 10–15; #3, 15–20; #4, 20–25. Each point represents the mean ± SEM of four papillae (Schmidt-Nielsen & Graves 1982).
