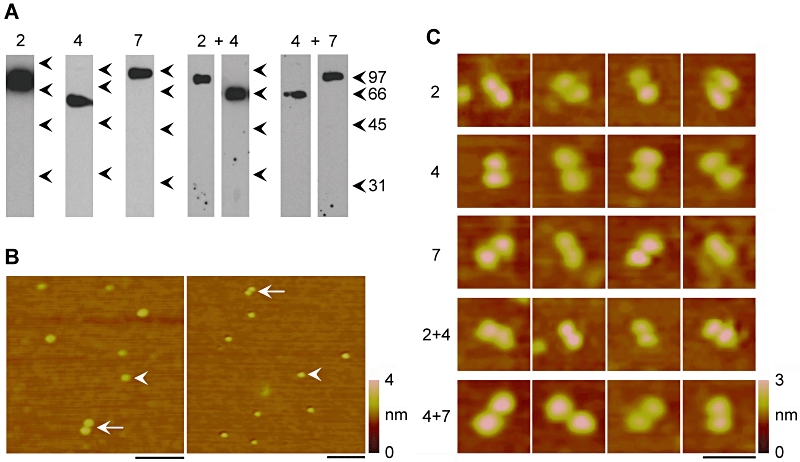
Figure 5.

Atomic force microscopy (AFM) imaging of P2X receptors of various subunit compositions. (A) His6-P2X2 and His10-P2X7 were isolated from detergent extracts of cells through binding of their His tags to Ni2+-agarose beads, followed by elution with imidazole. P2X4-HA was isolated through binding of its HA tag to anti-HA immunoaffinity beads, followed by elution with HA peptide. P2X subunits were either expressed alone or in the combinations His6-P2X2+P2X4-HA (with pull-down of His6-P2X2) or P2X4-HA+His10-P2X7 (with pull-down of His10-P2X7). Eluted samples were subjected to SDS-PAGE followed by immunoblotting with either a rabbit polyclonal anti-P2X2 antibody, a mouse monoclonal anti-HA (P2X4-HA) antibody or a rabbit anti-P2X7 antibody. Immunoreactive bands were visualized using enhanced chemiluminescence. Arrowheads indicate molecular mass markers (kDa). (B) Low-magnification AFM images of a sample isolated from cells expressing P2X4-HA. The arrowheads indicate single receptors; arrows indicate double receptors. A colour-height scale is shown at the right. Scale bars, 100 nm. (C) Gallery of zoomed images of double receptors present in samples isolated from cells expressing all five subunit combinations. A colour-height scale is shown at the right. Scale bar, 50 nm. HA, haemagglutinin; PAGE, polyacrylamide gel electrophoresis.
