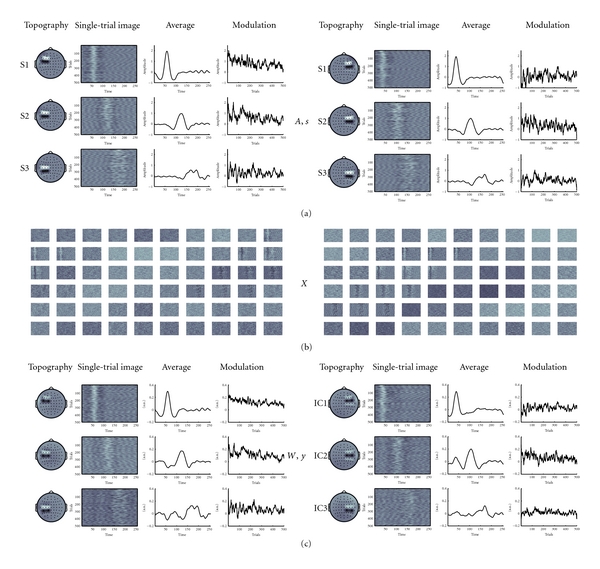
Figure 2.

Hybrid Data. The figure shows two hybrid datasets with three source topographies (A) and timecourses (s) on top, the mixture of the sources with real EEG (X) in (b), and the reconstruction of the sources after group ICA (W, y) in (c) section.
