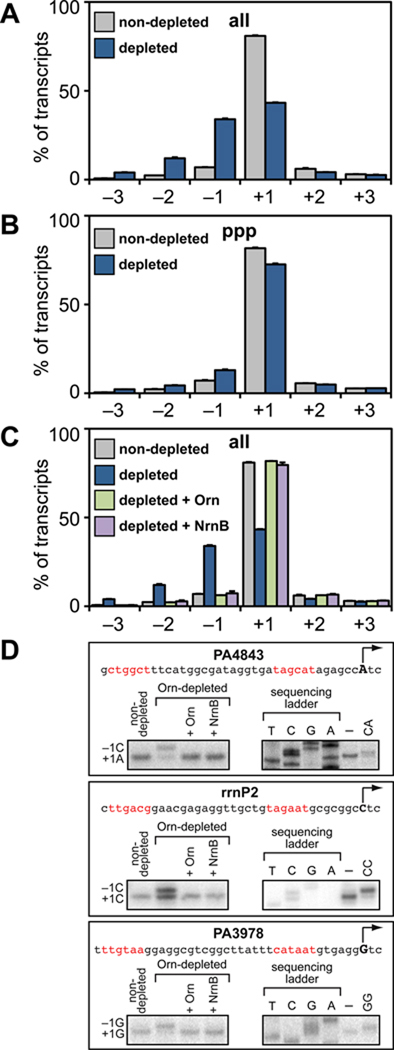
Figure 3. NanoRNAs prime transcription initiation in vivo.
A. – C. Accumulation of nanoRNAs leads to TSS shifting as detected by high-throughput sequencing. Graphs show average percentage of all transcripts (panels A and C) or 5' triphosphate carrying transcripts (panel B) initiated at positions −3 to +3 relative to the primary TSS for 148 promoters. Data were derived from the analysis of transcripts isolated from cells of strain JS1.F harboring plasmid pPSV35 (non-depleted), and cells of strain JS3.F harboring plasmids pPSV35 (depleted), pPAOrn (depleted + Orn), or pNrnB (depleted + NrnB). Plotted are the averages and standard deviations for two independent measurements (Table S3).
D. TSS shifting observed in vivo can be recapitulated in vitro using 2 nt RNAs. Shown is the sequence of the rrnP2 promoter, the promoter associated with PA4843, and the promoter associated with PA3978. The primary TSS (position +1) is indicated by the arrow and putative promoter elements are in red. The box on the bottom left of each panel shows the results of primer extension analysis performed using transcripts isolated from the indicated cells. The box on the bottom right of each panel shows primer extension analysis of RNA transcripts produced during in vitro transcription assays performed in the absence (–) or presence of the indicated 2 nt RNA (see Supplemental Information for details).

