Figure 5.

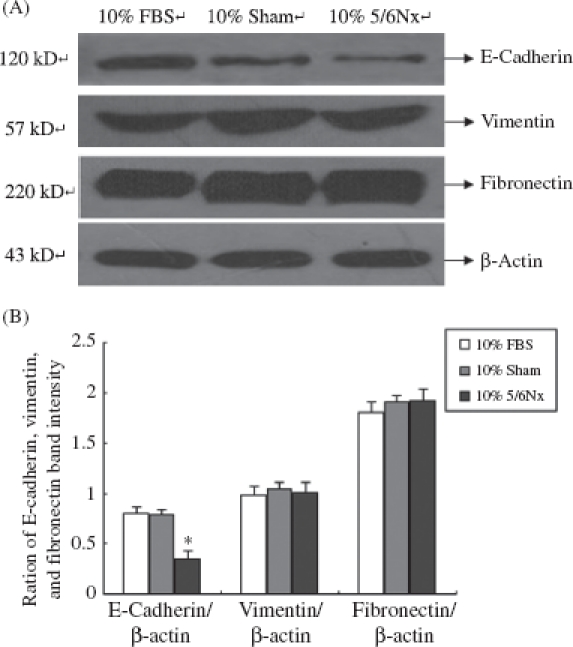
Expression of E-cadherin, vimentin, and fibronectin in HK-2 cells. (A) Western blot of E-cadherin, vimentin, and fibronectin. Lanes 1-3 are 10% FBS group, 10% sham operation serum group, and 10% 5/6 nephrectomized rat serum group, respectively. (B) E-cadherin, vimentin, and fibronectin protein levels. Data were expressed versus β-actin and compared with ANOVA.
Notes: The experiment was repeated three times with similar results. * Denotes p < 0.05 versus 10% sham operation serum group.
