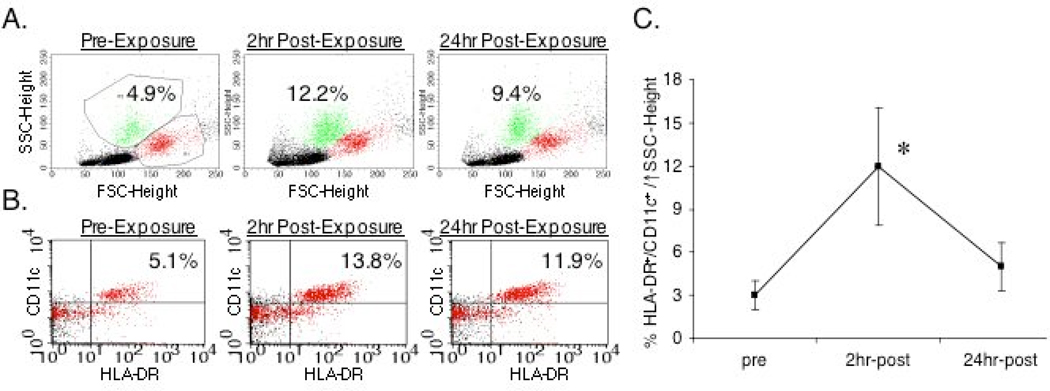
Figure 8.
In vivo monocyte/macrophage response to isocyanate exposure. The peripheral blood cells of human subjects exposed to 20 ppb isocyanate (HDI) for 2 hrs, were analyzed by flow cytometry. Panel A shows light scatter and Panel B shows HLA-DR/CD11c dot plots from a representative subject pre-exposure, 2hr and 24 hr post exposure. The percentages of cells in the gated region or quadrant are shown. Panel C summarizes the percentage of HLA-DR+/CD11c+ cells with shifted light scatter (as gated) in the peripheral blood of five different subjects at each time point (mean +/− S.E.). Pre-exposure and 2 hr post-exposure values are significantly different (p<0.01).

