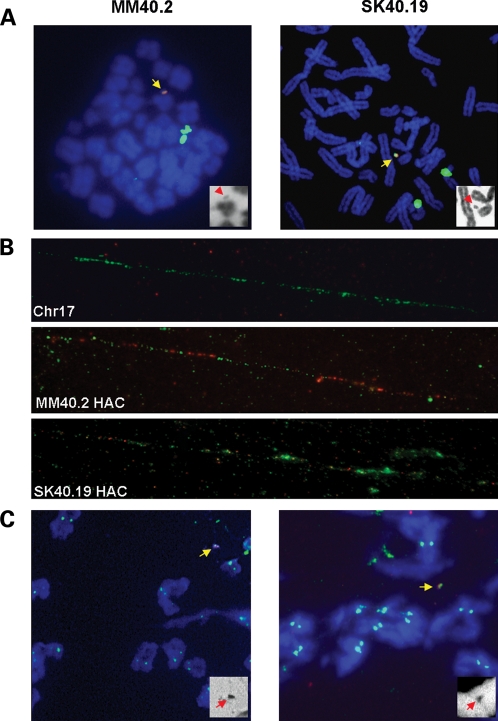
Figure 2.
HAC analysis. (A) FISH with a 17α DNA probe (green), and a vector probe (red). The chromosomes are counterstained in DAPI, blue. The HAC are identified by yellow arrows. The insets show DAPI staining only (HAC, red arrows), in black and white. (B) Fibre FISH on HAC clones, with 17α DNA (green) and vector DNA (red) probes. (C) ImmunoFISH with anti-CENP C antibody (green), and 17α HAC probe (red).

