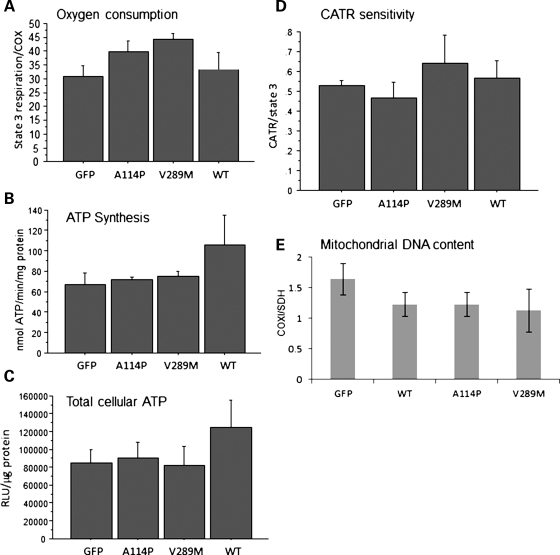
Figure 3.
Mitochondrial properties of human ANT1 expressing myotubes. (A) ADP-driven state 3 respiration in permeabilized C2C12 myotubes expressing GFP, WT, A114P and V289M ANT1 (DM6). State 3 respiration rates were normalized by COX activity to adjust for differences in the mitochondrial content (n = 4). (B) Mitochondrial ATP synthesis in DM6 ANT1 expressing cells with glutamate and malate as substrates (n = 3). (C) Total cellular ATP content (n = 4). (D) The CATR : state 3 respiration ratio is shown, as a measure of the ANT1 sensitivity to CATR (0.5 μM), in permeabilized DM6 myotubes expressing GFP, WT and mutant ANT1. n = 5 for WT, A114P and GFP, n = 3 for V289M. (E) mtDNA content in DM7 myotubes expressing ANT1 for 4 days. Ratio of the mtDNA gene (COXI) to the nuclear DNA-encoded gene (SDH) relative to naive C2C12 cells was determined by real-time PCR (n = 3).

