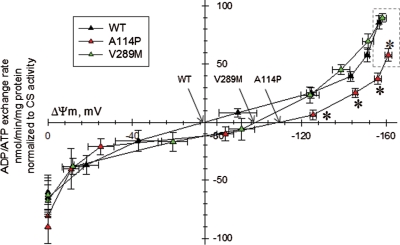
Figure 4.
ADP–ATP exchange rate/ΔΨm profile of C2C12 myotubes expressing WT and mutant ANT1. Plot of ADP–ATP exchange rate mediated by ANT versus ΔΨm in in situ mitochondria of WT, A114P and V289M C2C12 permeabilized cells depolarized to various voltages by increasing amounts of SF 6847, and normalized to specific citrate synthase activity. Each point in the graph represents the average ADP–ATP exchange rate calculated by linear regression of the magnesium green fluorescence, calibrated and converted to ATP appearing in the medium, as a function of calibrated safranine O values. Erev_ANT points are indicated by arrows. Dashed box highlights the ΔΨm values prior to addition of the uncoupler SF6847, which is smaller for A114P myotubes. Each point is the average of five to seven independent experiments. *: Statistically significant by one-way ANOVA followed by Tukey's post-hoc test versus WT, P = 2.0e−3 (ADP), 4.0e−3 (10 sf), 0.043 (20 sf) and 0.045 (30 sf).

