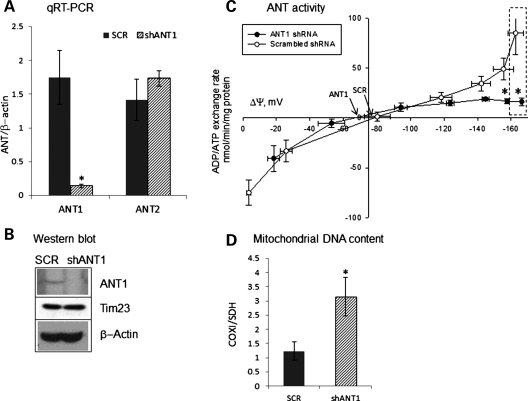
Figure 5.
Biochemical profiles of Ant1-silenced C2C12 myotubes. (A) Ant1 and Ant2 mRNA levels in Ant1-silenced (shAnt1) and scrambled control (SCR) C2C12 myotubes normalized to β-actin mRNA. *: Statistically significant by unpaired, two-tailed Student's t test, P = 0.007. (B) Western blot for Ant1 expression in shAnt1 and SCR C2C12 myotubes. Translocase of the IM (Tim23) and β-actin levels in the lysate were used as loading controls for mitochondrial and cytosolic proteins, respectively. (C) ADP–ATP exchange rate versus ΔΨm in mitochondria of Ant1-silenced C2C12 cells. Dashed box highlights the ΔΨm values prior to addition of the uncoupler SF6847, which is smaller for ANT1-silenced myotubes. *: Statistically significant by unpaired, two-tailed Student's t test, P = 0.02. Each point is the average of four independent experiments. (D) mtDNA content in Ant1-silenced and scrambled control C2C12 myotubes shows 3-fold higher mtDNA in Ant1-silenced cells (n = 5). *: Statistically significant by unpaired, two-tailed Student's t test, P= 0.034.

