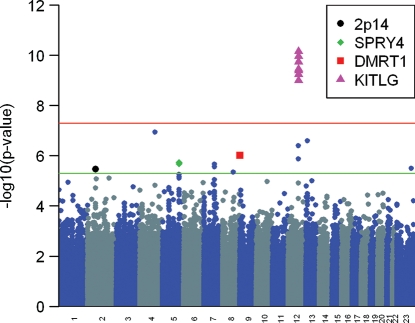
Figure 1.
Manhattan plot of GWA results for 349 TGCT cases and 919 controls. SNP markers that reached significance at P < 5.0 × 10⁻⁶ based on Fisher's exact test are plotted above the lower line. Susceptibility loci identified in our original (KITLG, SPRY4, 2p14) and current (DMRT1) analysis are indicated.

