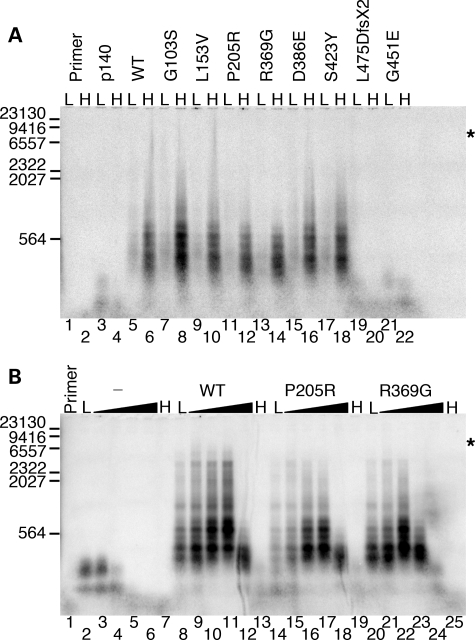
Figure 4.
Functional interaction of p55 variants with the catalytic subunit. Reactions were analyzed by alkaline gel electrophoresis (Materials and Methods) and contained 2 nm singly primed M13mp18 DNA, 5 nm p140 and 10.5 nm monomeric p55 or variant unless otherwise indicated. (A) Initial screening for processivity of recombinant variants. L, low salt (none added to the reaction); H, high salt (reactions supplemented with 100 mm NaCl); p140, p140 only added to the reaction; WT, wild-type p55. (B) Reactions containing 0, 50, 100, 150, 200 and 250 mm supplemental NaCl. The gradient from low (L, none added) to high salt (H, 250 mm NaCl) is indicated by black triangles above each variant or the wild-type p55 (WT). The hyphen (-) indicates the absence of p55 in these reactions (p140 only). Primer, no protein added to the reaction. Markers, number of λ-DNA/HindIII fragment nucleotides labeled with [α-32P]dTMP. Log(λ-DNA/HindIII nucleotide fragments) was plotted against band migration distance (millimeters), and linear regression generated a correlation coefficient of 0.97 over the range analyzed (23,130, 9416, 6557, 2322, 2027 and 564 nucleotides). This standard curve was used to estimate the size of polymerase γ products observed on the alkaline gel, whereas shorter products were observed directly on denaturing PAGE (data not shown). Asterisks indicate the position of full-length primer-extension products (7249 nucleotides).

