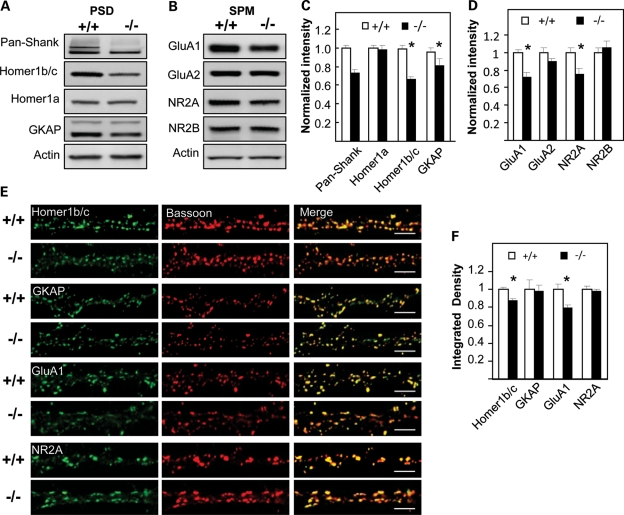
Figure 6.
Altered protein composition in PSD and SPM fractions of Shank3e4–9 mice. Immunoblot analyses of PSD (A) and SPM (B) fractions from individual Shank3+/+ and Shank3e4–9 mice for the indicated proteins. Pan-Shank (Shank1–3) antisera revealed an absence of the Shank3 band in Shank3e4–9 mice. Homer1b/c and GKAP in the PSD and GluA1 and NR2A in the SPM are reduced in Shank3e4–9 mice. (C and D) Quantification of proteins in PSD fractions based on results shown in (A) and (B), respectively, normalized using actin for protein quantification. There is a significant reduction in the levels of the indicated proteins in Shank3e4–9 compared with Shank3+/+ samples. Homer1b/c (n = 16 each/genotype, *P< 0.001), GKAP (n = 11 each/genotype,*P= 0.03), GluA1 (n = 8 each/genotype,*P< 0.002) and NR2A (n = 8 each/genotype, *P= 0.02). No sex difference was observed. There is no significant differences for other proteins including Homer1a (n = 11 each/genotype), GluA2 (n = 8 each/genotype) and NR2B (n = 8 each/genotype). (E) Hippocampal neurons in dissociated culture (16–18DIV) from Shank3+/+ or Shank3e4–9 mice (n = 8 each/genotype) were immunostained with bassoon antibody (red) and with GKAP, Homer1b/c, GluA1(C-terminus) or NR2A antibodies (green). Merged images shown on the right. Scale bar = 5 µm. (F) Normalized integrated density for the indicated proteins (Shank3+/+= 1.00). Significant differences were found for Homer1b/c and GluA1 proteins between Shank3+/+ and Shank3e4–9 samples (*P< 0.01 for Homer1b/c and *P< 0.001 for GluA1). No significant differences were found for GKAP and NR2A.

