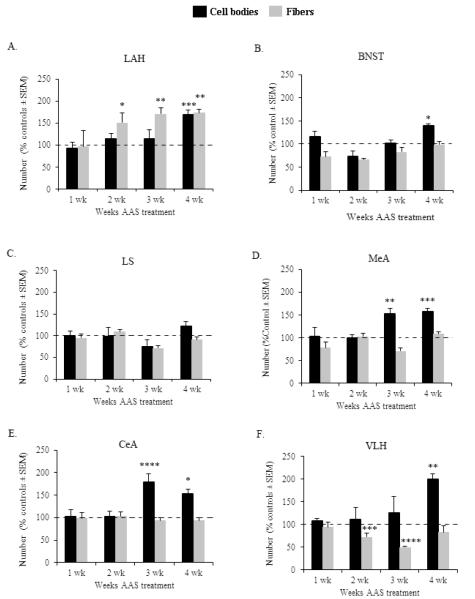
Figure 4.
Graph depicts the time course of AAS-induced neurodevelopmental changes in VGLUT2-immunoreactive cell bodies (black bars) and fibers (grey bars) within the (A) latero-anterior hypothalamus (LAH), (B) bed nucleus of the stria terminalis (BNST), (C) lateral septum (LS), (D) medial amygdala (MeA), (E) central amygdala (CeA) and (F) ventrolateral hypothalamus (VLH) of animals treated with AAS for 1, 2, 3 and 4 weeks. Data are expressed as percentage of vehicle responding, as indicated by the 100% dashed lines in graph. *p < 0.05, **p < 0.01, ***p < 0.005, ****p < 0.001, two-way ANOVA (treatment × time point) followed by Fisher’s protected least significant post hoc (AAS vs SO for each time group).

