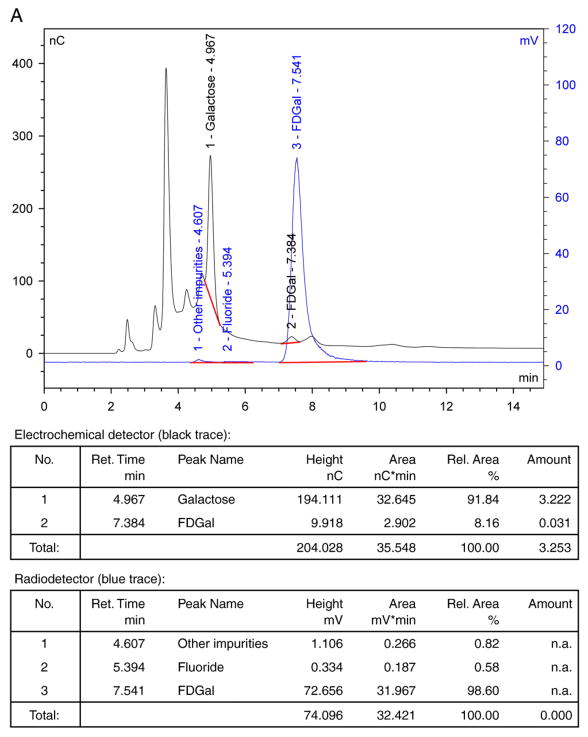
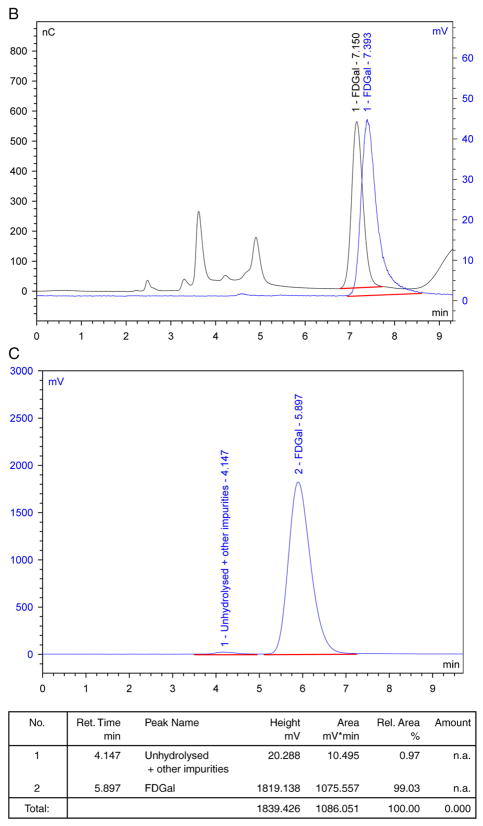
Fig. 1.
Typical quality control HPLC chromatograms for FDGal. Black traces are signals from the electrochemical detector, while blue traces are signals from the radio-detector: (A) Chromatograms of final solution on Dionex Carbopac PA1. (B) Chromatograms of final solution spiked with authentic FDGal on Dionex Carbopac PA1. (C) Radio-chromatogram of final solution on amino sugar column.


