
Figure 4. Golgi-Cox impregnated neurons in the hippocampus of control (WT) and Rac1 mutant mice (KO).

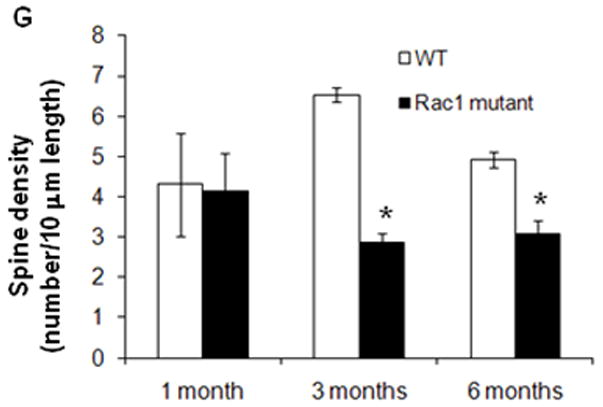
Panels A1-2, B1-2, C1-2, D1-2, E1-2, F1-2 illustrate the morphology of neurons in the CA1 (10 X, scale bar = 60μm). Panels A3-4, B3-4, C3-4, D3-4, E3-4, F3-4 show a close up of a dendritic branch and spines (100 X, scale bar = 5μm). G) Quantification of spine densities in the dendrites of CA1 neurons of Rac1 mutant mice showed a significant decrease in spine number starting at 3 months of age respect to control mice (WT) (* p<0.01, t-test)