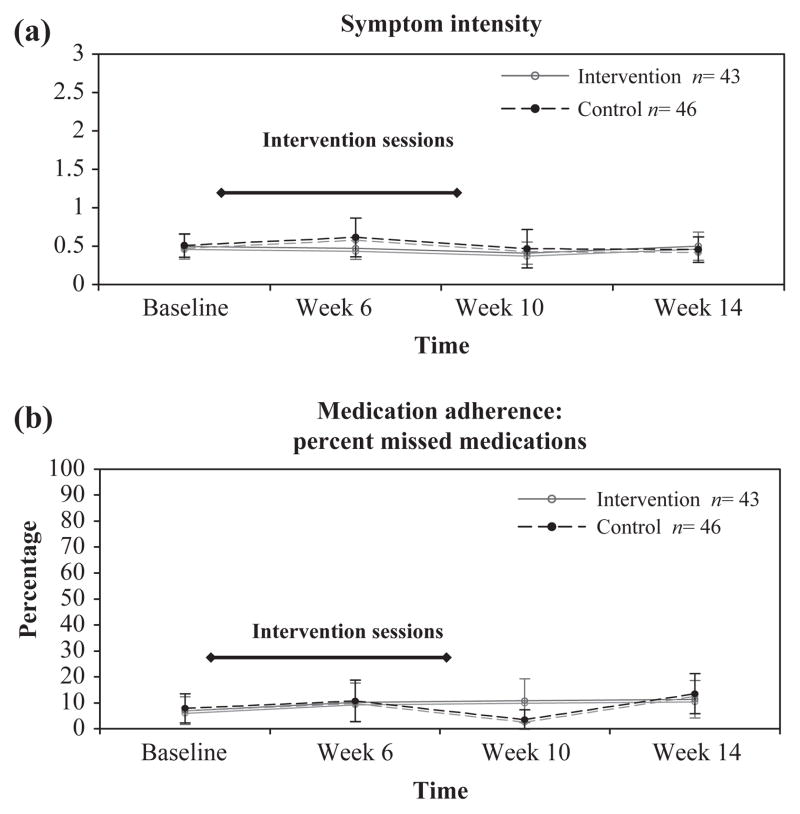
Figure 2.
Line graphs of mean scores with 95% confidence intervals for the sign and symptom checklist-HIV revised and the percentage of missed HAART doses by group and time period. (a) SSC-HIV(rev) mean scores with 95% confidence intervals by group at baseline and weeks 6, 10, and 14. Higher scores indicate worse symptom intensity in the past 24 hours when 0 = no symptoms; 1 = mild symptoms; 2 = moderate symptoms; and 3 = severe symptoms. Error bars indicate 95% confidence interval of the mean (standard error of the mean). Intervention sessions occurred during weeks 2–8. (b) Mean percentage of missed HAART doses in the past week with 95% confidence intervals at baseline and week 6, 10, and 16. Error bars indicate 95% confidence interval. Intervention sessions occurred during weeks 2–8.

