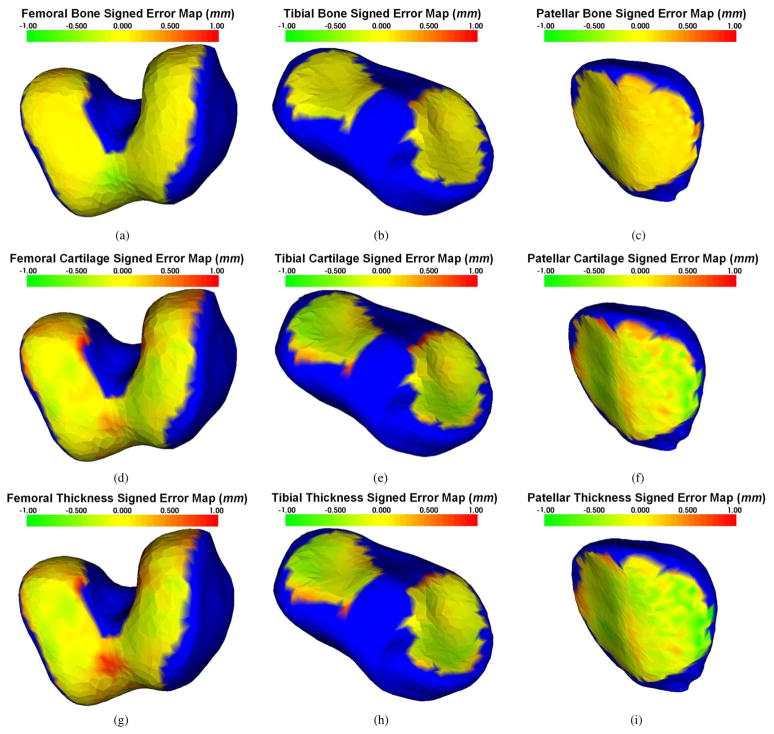
Fig. 9.
Distribution of mean signed surface positioning errors superimposed on mean shapes of the three bones forming the knee joint. In all panels, blue color corresponds to bone areas not covered by cartilage when mapped to mean shape. The range of colors from green to red corresponds to surface positioning errors ranging from −1 to +1 mm. Panels (a)–(c) show bone surface positioning errors, (d)–(f) show cartilage surface positioning errors, and (g)–(i) mean signed errors of computed cartilage thickness. Note that the yellowish color corresponds with zero error, visually demonstrating only a small systematic segmentation and thickness assessment bias across all cartilage regions.

