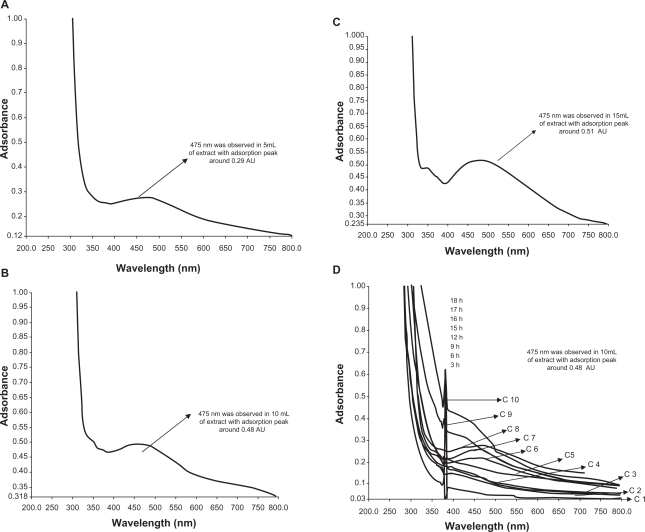
Figure 2.
UV-vis adsorption spectra of silver nanoparticles after bioreduction kinetics of the reaction of M. edule leaf extract with aqueous silver ions at 5 mL (A), 10 mL (B), 15 mL (C) in the concentration range of 200–800 nm with different time intervals. A) 5 mL of silver and leaf aqueous solution (B) 10 mL of silver with leaf aqueous solution and (C) 15 mL of silver with leaf aqueous solution. D) Curves 1–10 correspond to 3, 6, 9, 12, 15, 16, 17, 18, 21, 24 hours of reaction time, respectively, in 15 mL of leaf extract with silver aqueous solution.
Abbreviation: C, curves.

