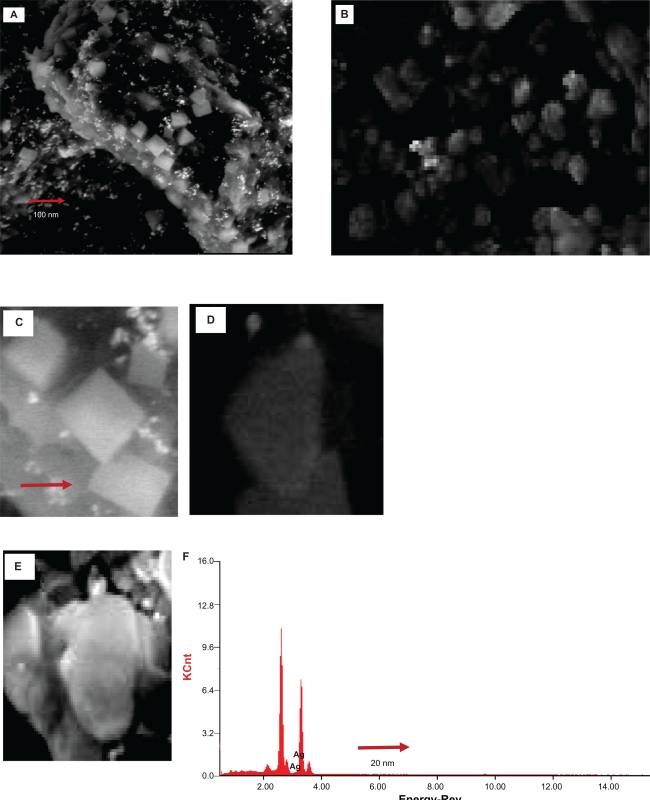
Figure 3.
SEM images of the silver nanoparticles after bioreduction of AgNO3 with Memecylon edule leaf extract. 100 nm (A), 50 nm (B), SEM images of silver nanoparticles with corresponding (SAED) selected area electron diffraction patterns showing square-shaped crystals (C), irregular-shaped particle (D), and triangular-shaped particle in 20 nm (E). EDAX profile of silver nanoparticles resulting from the experiment by using the 15 mL of M. edule extract. (F).
Abbreviations: SAED, selected area electron diffraction; EDAX, energy dispersive X-ray.

