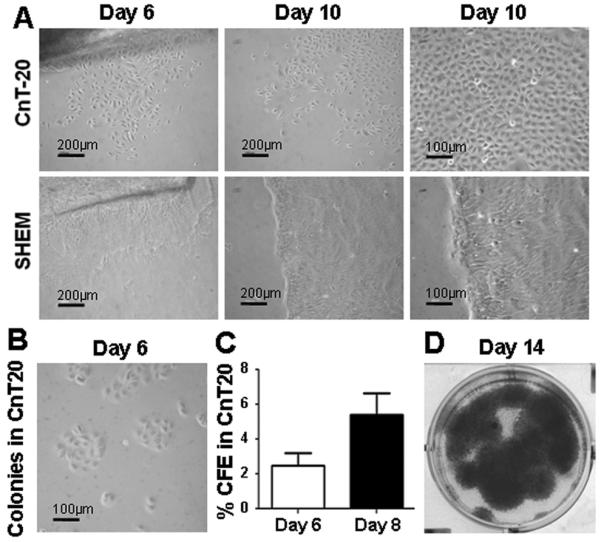
Fig. 2.

Growth pattern and capacity of HCECs in CnT-20 or SHEM medium. A. Representative phase images showing primary HCECs (P0) growing from limbal explants in CnT-20 or SHEM at Days 6 and 10 (with low and high magnification); B. Clonal growth of HCECs at day 6 in CnT-20 without feeder layer; C. Percentage colony-forming efficiency (CFE) of HCECs at days 6 and 8 in CnT-20 without feeder layer. Shown as mean ± standard deviation, n=3; D. Representative cultures stained with 1% rhodamine showing growth capacity of HCECs at day 14 in CnT-20 without feeder layer.
