
Fig. 10.
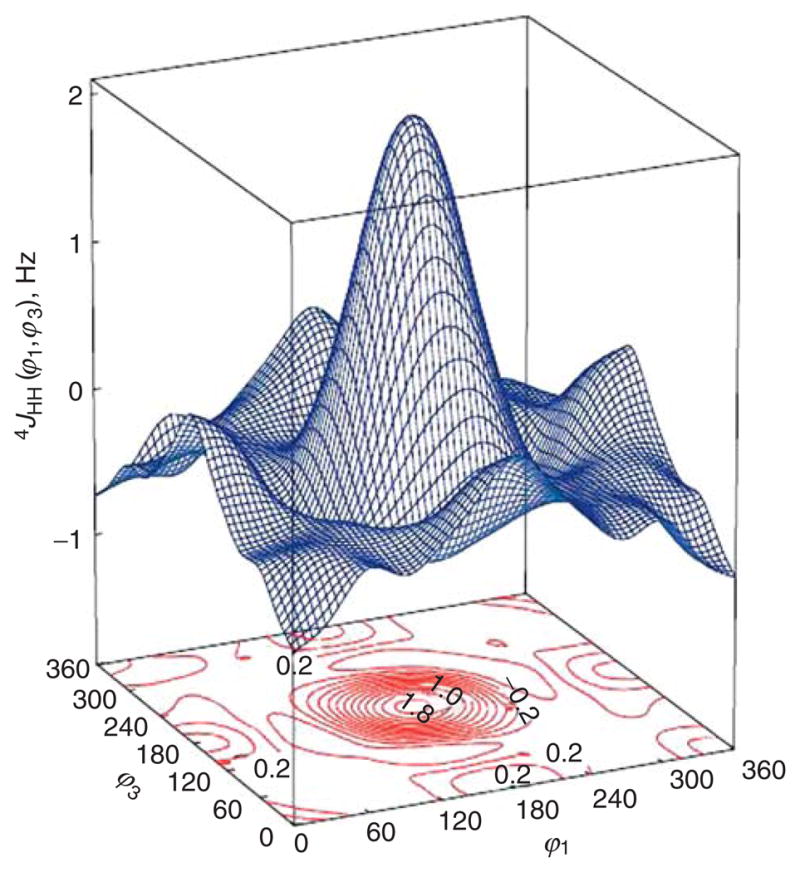
3D plot and contour map for 4JHCCCH in propane, calculated as a function of the dihedral angles ϕ1 and ϕ3 by DFT/FPT at 30° intervals of the angles. 3D spline interpolations were used to create the graphs, which illustrate how the coupling constant changes sign, depending on the values of ϕ1 and ϕ3. A maximum positive value is seen for ϕ1 = ϕ3 = 180°.