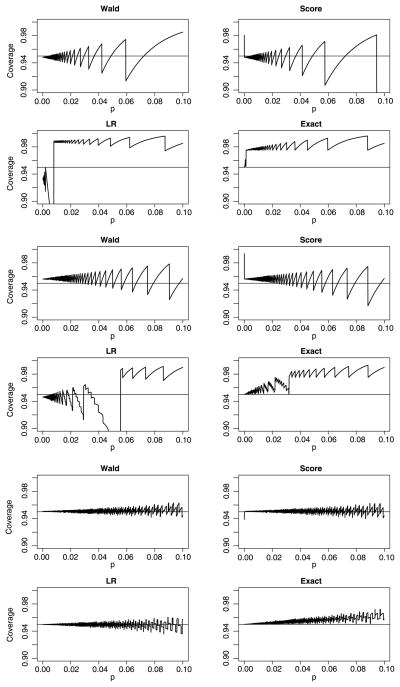
Figure 4.
Exact coverage probability for 95 percent Wald, score, LR, and exact confidence intervals when s = 20. Top four: n = 1; Middle four: n = 5; Bottom four: n = 100. Within each block of four, the intervals are arranged as Wald (upper left), score (upper right), LR (lower left), and exact (lower right).

