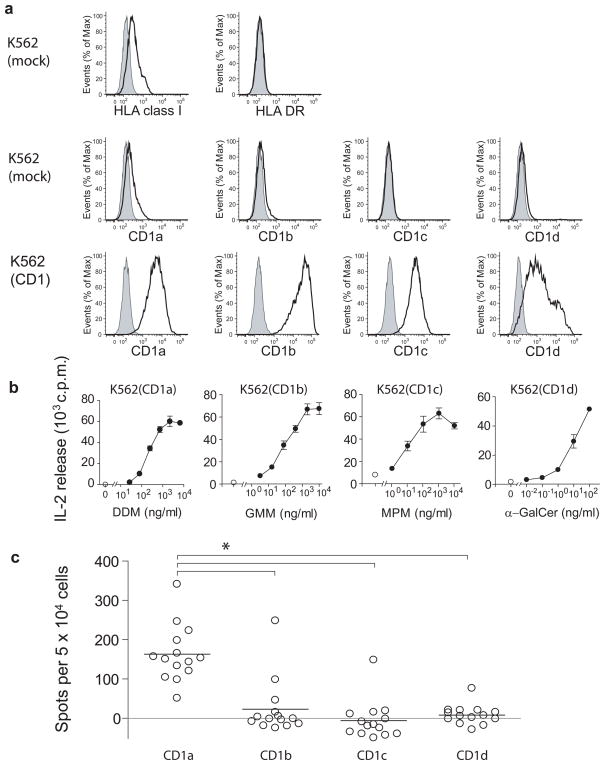
Figure 1. A population study of CD1 autoreactive cells in blood of human donors.
(a) Surface expression of MHC and CD1 in K562 cells stably transfected with vector only (mock) or with vector containing the indicated human CD1 gene. Open histograms: MHC or CD1 staining, filled histograms: Isotype control. Results are representative of three or more experiments. (b) HT2 bioassay of IL-2 release in the supernatant of K562 cells incubated for 24 h with T cell lines recognizing CD1a and dideoxymycobactin (DDM), CD1b and glucose monomycolate (GMM), CD1c and mannosyl phosphomycoketide (MPM) or CD1d and α galactosyl ceramide (mean ± S.D.). Results are representative of three or more experiments. (c) Elispot of IFNγ release in polyclonal cell cultures from 14 donors stimulated in vitro with autologous DCs and analyzed for CD1 reactivity using K562-CD1 as APCs. IFNγ release is depicted as mean number of spots after subtraction of background spots formed in response to K562 transfected with vector alone. * (P<0.01) Dunnett’s Multiple Comparison Test after one-way ANOVA.

