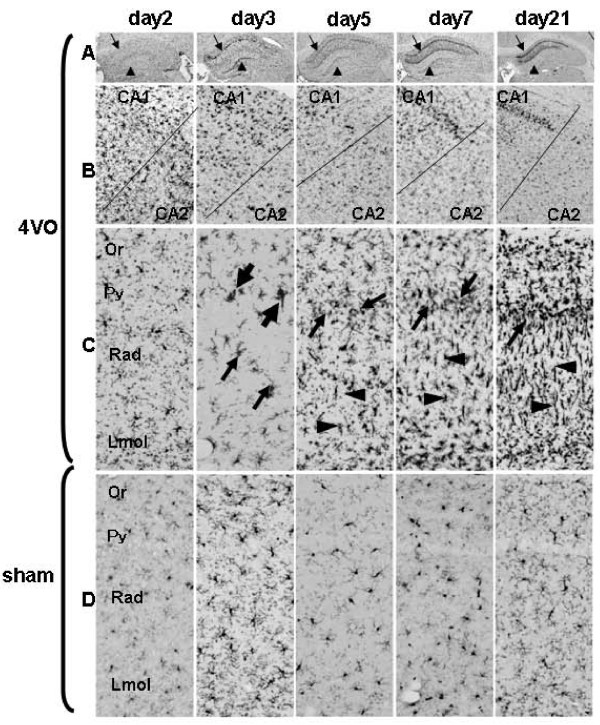
Figure 3.
Change of microglial cells after recirculation. Anti-Iba1 antibody was used to immunostain microglial cells. Rows A, B, C, and D represent different sections of the hippocampus. A: the entire hippocampus in 4VO, B: border between CA1 and CA2 in 4VO, C: larger magnification of CA1 of the hippocampus in 4VO, D: larger magnification of CA1 of the hippocampus in sham. C and D were taken from the rectangular area shown in Figure 1A. Arrows and arrow heads in row A show Py and dentate gyrus, respectively. In row B, the upper and lower sides of the images show CA1 and CA2, respectively. Arrows and arrowheads in row C indicate amoeboid microglial cells and rod cells, respectively. On day2, microglial cells began to be hypertrophic in the entire hippocampus. On day3, amoeboid cells (arrow) were observed in CA1 and clusters including 2 or 3 microglial cells (large arrows) were around Py. Between day5 and 21, Iba1+ amoeboid cells (arrow) in Py, rod cells with short processes in Rad (arrow head) and hypertrophic cells in Or and Lmol of CA1 in the hippocampus were observed.

