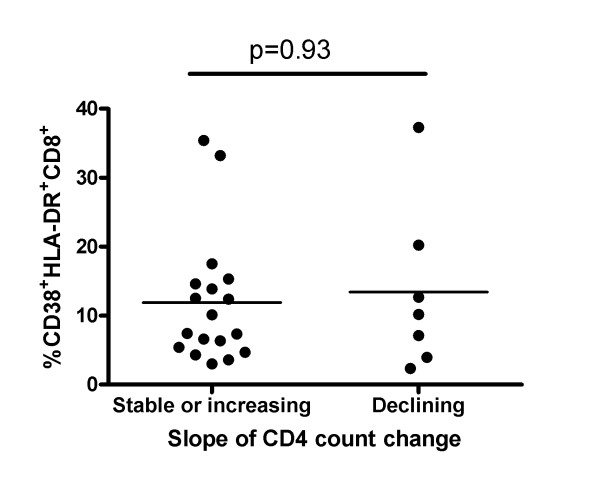
Figure 3.
Percent of CD38+DR+CD8+ T cells does not distinguish Elite Controllers with stable/increasing versus declining CD4 counts. Shown is a scatter plot comparing the percent of CD38+HLA-DR+CD8+ T cells in the EC group with stable or increasing versus decreasing CD4 counts. The bar through each scatter plot indicates the median value for the group. P-values shown correspond to between-group comparisons performed using a Mann-Whitney test.

