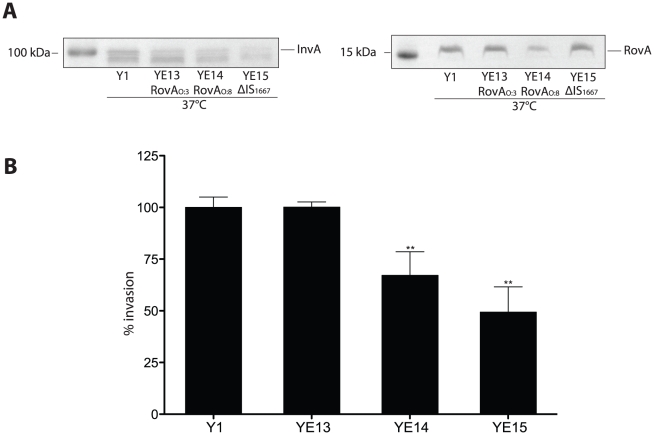
Figure 11. Influence of enhanced invasin and RovA levels on Y. enterocolitica O:3 host cell invasion.
(A) Whole cell extracts were prepared from the cultures, separated on SDS-polyacrylamide gels and analyzed by western blotting using polyclonal antibodies directed against InvA and RovA. As a molecular marker the PageRuler Prestained Protein Ladder was loaded on the left. (B) YeO:3 strains Y1 (wt), YE13 (rovAO:3S98), YE14 (rovAO:8P98) and YE15 (rovAO:3ΔIS1667) were grown at 37°C. Approximately 106 bacteria were centrifugated onto 104 HEp-2 cells. Total numbers of intracellular bacteria were determined and are expressed relative to the invasion rate of YeO:3 strain Y1 defined as 100%. Each value represents the mean of at least three different assays done in triplicate. Data were analyzed by the students t test, **, significantly different from Y1 or YE13 with P<0.001.

