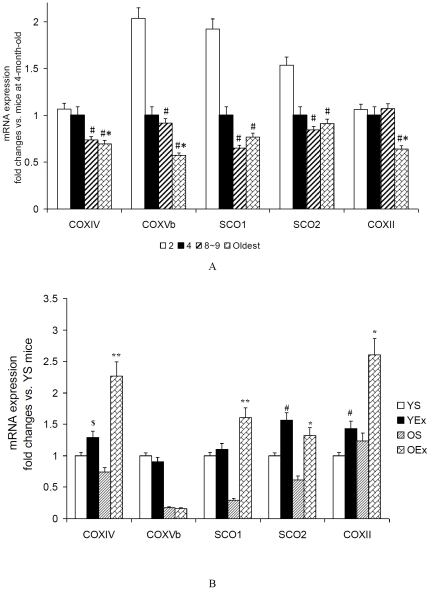
Figure 3. Gene expression of COX subunits and assembly proteins in cardiac muscle.
A: Gene expression of COX subunits and assembly proteins from mice at different age. Data are presented as mean ± SEM (n = 8) and displayed as fold changes vs. mice at 4 months of age. The statistical significance of differences was calculated by using one-way ANOVA. *P<0.05 vs. mice at 4 months of age, #P<0.05 vs. mice at 2 months of age. B: Gene expression of COX subunits and assembly proteins from exercised mice. Data are presented as mean ± SEM (n = 8) and displayed as fold changes vs. YS mice. The statistical significance of differences was calculated by students' t test. *P<0.05, **P<0.01 vs. OS mice, #P<0.05, $ P = 0.064 vs. YS mice.

