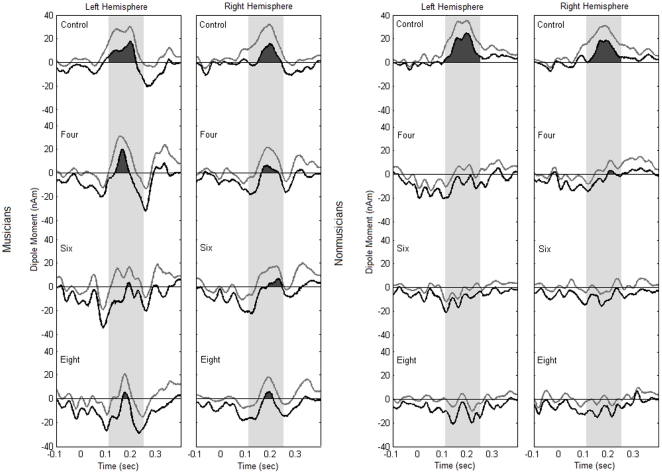
Figure 5. Lower boundaries (black traces) of generated bootstrapped confidence intervals for signal amplitudes (grey traces) for both groups in the three experimental conditions (four, six and eight tones) and the control condition for both hemispheres.
Lower confidence intervals larger than zero indicate that there is significant deflection of source waveform. This is the case in all experimental conditions in both hemispheres for musicians, but only in the control condition, and in the four tone condition (right hemisphere) for non-musicians.

