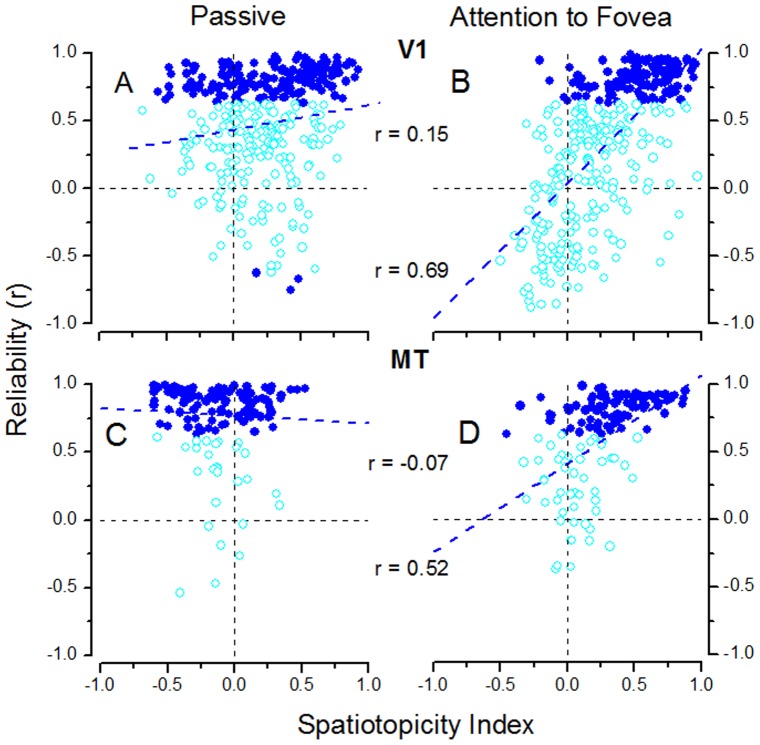
Figure 5. Voxel Reliability in areas V1 and MT.
Reliability of voxel response plotted against spatiotopy index for the right hemisphere of subject S2. A & B area V1 (entire area); C & D area MT. Reliability was the correlation coefficient calculated by regressing the hemodynamic modeled response against the average response timecourse to all stimuli that were contralateral in both spatiotopic and retinotopic coordinates (left of both screen center and fixation). Blue symbols indicate significant reliabilities (1-tailed, p<0.05), light blue non-significant. The values of r are the correlation coefficients for regressing the reliability indexes and spatiotopy indexes.

