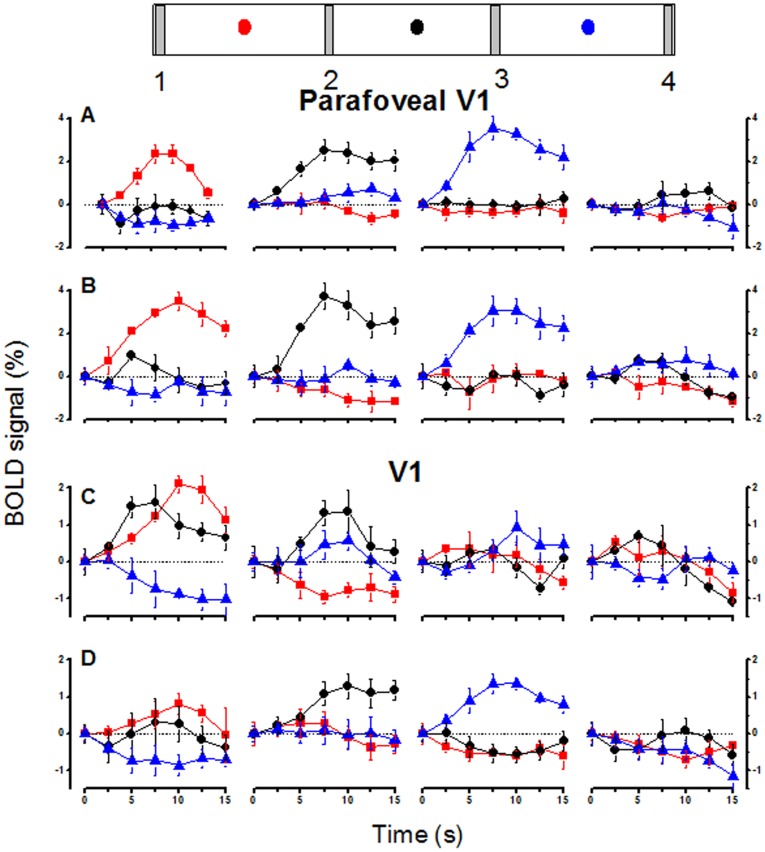
Figure 8. V1 averaged timecourses of BOLD responses.
Average timecourse of responses to four different stimuli at three different fixations, for parafoveal V1 (a continent region where voxels responded primarily to the adjacent contralateral bar in central viewing: A and B) and the entire V1 region (C and D), during passive observation (A and C) and attention to the fovea (B and D). The icons indicate the stimuli (labeled 1–4), and the dots the fixation (corresponding to the color-coded time-courses shown below). All timecourses are averaged across hemispheres whitin subjects and then across subjects, with the responses and fixations of the left hemispheres flipped to make them analogous to those of the right (see methods). Bars represent ±1 s.e.m. across subjects. All curves are shifted to have zero amplitude time zero (stimulus onset), for display purposes.

