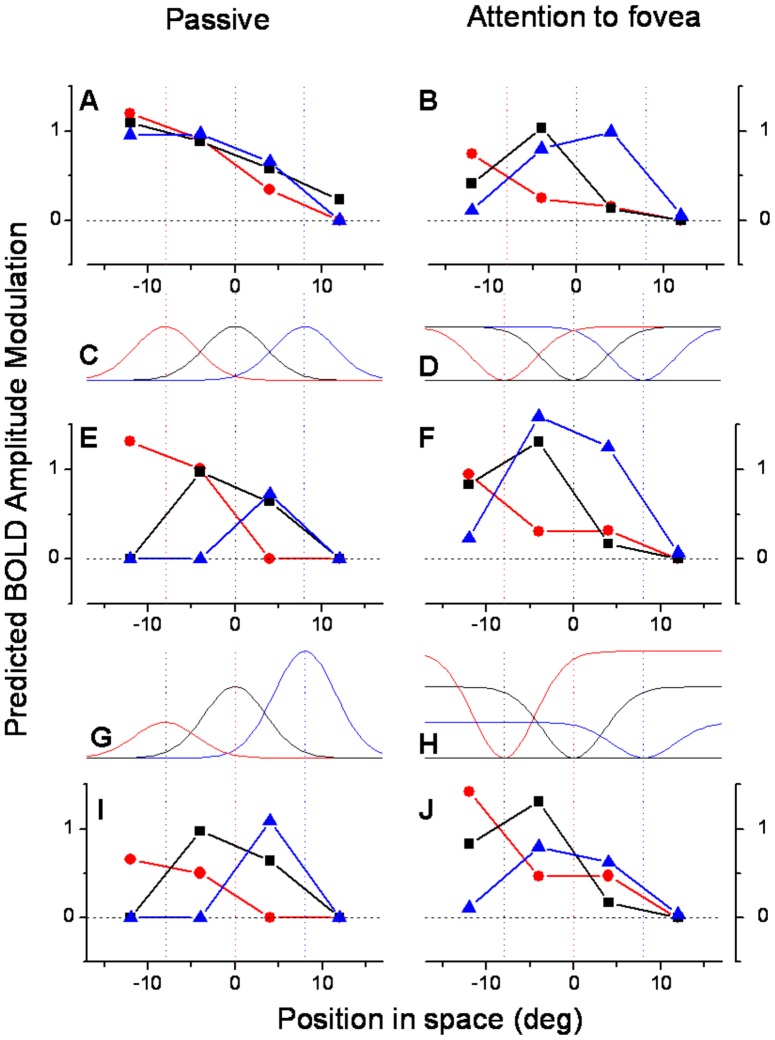
Figure 11. Attentional effects on MT BOLD response amplitudes.
A & B: MT BOLD response amplitudes, averaged over subjects and hemispheres, as a function of the spatiotopic stimulus coordinates (0 is screen center), during passive fixation (A) and during the foveal attentional task (B). The data are taken from Fig. 1, with negative values clipped to zero (to avoid these becoming over-exaggerated during the multiplication modeling). Like Fig. 1, the responses are color-coded by fixation (red −8°, black 0°, blue +8°: fixation indicated by the dotted colored lines). C and D: The attentional effects on the BOLD response were first simulated by multiplying the non-attentional responses of Fig. 11-A with a Gaussian function with a 4° spread constant centered at fixation (C), and the attentional responses with the complementary function (1 minus the Gaussian function D). E. Boosting the response to more foveal stimuli changed the shape of the spatial tuning of BOLD responses, making them more retinotopic with D'Avossa and Gardner indexes of (0.52 and 0.34 respectively: see Table S2). F: Applying the complementary operator failed to generate spatiotopically selective responses from the retinotopic responses of Fig. 11-B, leaving both indexes of spatiotopicity virtually unchanged (Table S2). A variety of Difference of Gaussian operators were attempted, but none made the response more spatiotopic. G & H. To achieve spatiotopicity, the responses need to be modulated by a gaze-contingent function. H. shows the inverse Gaussian operators of D multiplied by a gain field that boosts leftward gaze. G shows the Gaussian boosting function multiplied by the inverse gain field (to attempt to recover the retinotopic base). I & J. Result of both attentional boost and gainfields. The spatiotopic functions of A become retinotopic (I), and the retinotopic function of B become spatiotopic (J).

