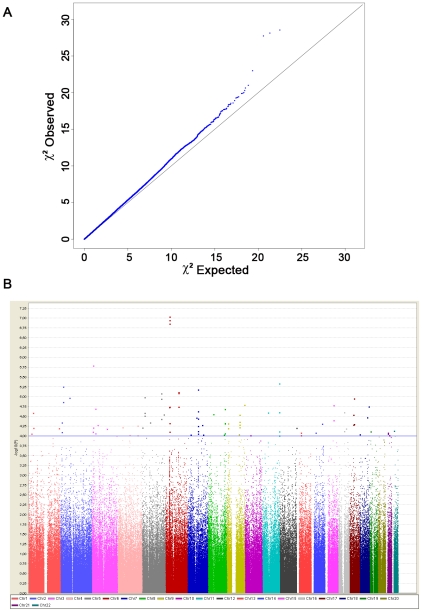
Figure 1. Genome-wide association results from the discovery phase.
(A) Quantile-quantile plot for test statistics (logistic regression test) for 489,814 SNPs passing quality control. The plot shows a close match to the test statistics expected under the null distribution (λ = 1.03). (B) Manhattan plot representing the P values across the genome. The −log10 P of the logistic regression test (y axis) from 489,814 SNPs in 564 systemic sclerosis patients and 1,776 controls is plotted against its physical position (x-axis) on successive chromosomes. 90 SNPs with P<10−4 lie above the blue horizontal line and are listed in Table S1. Highly significant association was observed with SNPs within the MHC locus, including 1 SNPs that reached the conservative threshold for genome-wide significance (P<10−7).

