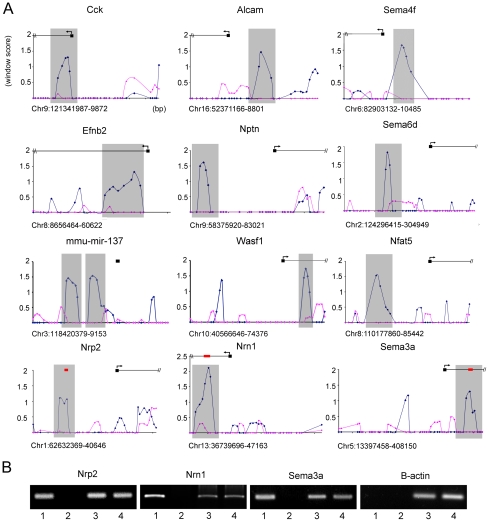
Figure 1. In vivo Foxp2 promoter occupancy in embryonic mouse brain.
(A) Foxp2-ChIP window enrichment scores of probes across promoters of a subset of putative targets from the neurite outgrowth and axon guidance pathways. The window score (Y axis) is given versus the distance across the promoter region (X axis) - each cross bar represents 1000 bp and each data point represents a single probe (chromosome and position in bp are given below the X axis of each graph). The enrichment in the wild-type experiments is shown by the blue trace, and the pink trace indicates the corresponding values in null mutant controls that lack Foxp2 protein. The predicted start site of the gene (as annotated on UCSC genome browser: http://genome.ucsc.edu/) is given by the black box and arrows denote the direction of transcription. Grey shading indicates the peak area of enrichment and the most likely region for Foxp2 binding to occur. (B) Analysis of in vivo promoter occupancy. DNA isolated via Foxp2-ChIP was PCR amplified using primers directed towards the promoter regions of Nrp2, Sema3a, Nrn1 or the β-actin control. The position of these amplicons within the target promoter region is given by red bars in part A. Results from E16 wild type mice were compared to those from homozygous null mutant littermates. Lane 1 = wild-type Foxp2-ChIP, lane 2 = mutant null Foxp2-ChIP, lane 3 = wild-type total DNA, lane 4 = mutant total DNA. Target gene promoters were found to be specifically enriched in Foxp2-ChIP samples isolated from wild-type brains compared to those from null mutant brains, unlike the β-actin control promoter. Gels are representative of results from triplicate experiments.

