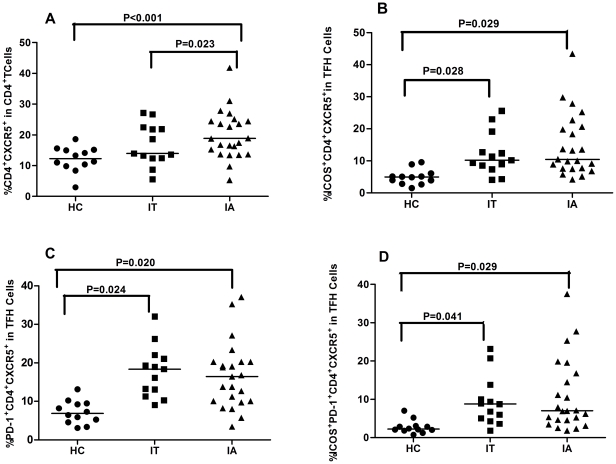
Figure 2. High frequency of TFH cells in the peripheral blood of IA patients.
(A) The percentages of CXCR5+CD4+ in the total CD4+ T cells. (B) The percentages of ICOS+CXCR5+CD4+ in total CXCR5+CD4+ cells. (C) The percentage of PD-1+CXCR5+CD4+ in total CXCR5+CD4+ cells. (D) The percentage of ICOS+PD-1+CXCR5+CD4+ in total CXCR5+CD4+ cells. Data are expressed as mean % of individual samples from at least two separate experiments. The horizontal lines show the median.

