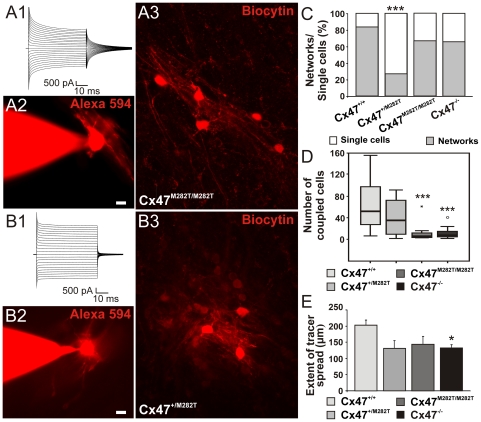
Figure 6. Comparison of oligodendrocytic coupling in the corpus callosum of postnatal 10- to 15-day-old Cx47+/M282T, Cx47M282T/M282T, and Cx47−/− compared to Cx47+/+ mice[23].
A1 and B1, Membrane currents of oligodendrocytes were recorded in response to a series of voltage steps ranging from −170 and + 50 mV (50 ms, 10 mV increments) from a holding potential of −70 mV. A2 and B2, Oligodendrocytes were identified by their typical morphology as revealed by dialysis with the fluorescent dye Alexa 594. A3 and B3, Superpositions of sequential confocal stacks indicating biocytin/streptavidin-Cy3 labeled networks. C–E, Quantification of networks in homozygous and heterozygous mCx47M282T as well as Cx47−/− mice compared to wildtype animals. C, Percentage of injected cells which were coupled to at least one other cell and thereby formed a network (dark gray) versus injected uncoupled cells (light gray). Note that in Cx47+/M282T mice only 27% of injected oligodendrocytes were found to be coupled. Asterisks indicate statistical significance (Chi Square Test, *** p<0.001). D, Boxplot indicating median (dark line), 25th and 75th percentiles (upper and lower hinges, respectively) of the number of coupled cells per network in Cx47M282T/M282T and Cx47+/M282T compared to wildtype mice. Similarly to Cx47−/− mice, Cx47M282T/M282T animals displayed a significant reduction in the number of cells participating in the oligodendrocytic network (6%; 4%–13%; Kruskal-Wallis test, p = 0.001, Mann-Whitney U-test, *** p<0.001). E, Extent of tracer spread as defined by the largest distance between two somata within the coupled network. No significant difference was observed between homozygous and heterozygous mCx47M282T mice compared to wildtype animals. In Cx47−/− mice, the extent of tracer spread was significantly reduced compared to wildtype animals (132±11 average, One way ANOVA p<0.05, Bonferroni post hoc test, p<0.05).

