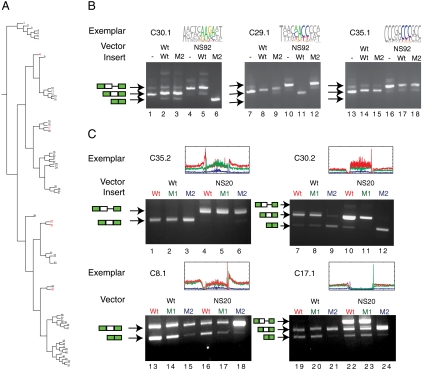
Fig. 3.
Minigene assay of element function confirms splicing differences between wild-type cluster exemplars and predicted mutants. (A) The clusters selected for functional analysis are indicated in red. (B) Exemplars drawn from each cluster are tested with their variants and no insert controls in several splicing reporter constructs. Total RNA from transfection into 293 cells was analyzed by RT-PCR. Arrows indicate the nature of the splicing product. M2 denotes the point mutant with the highest intraallelic L1 distance predicted to be most deleterious to the splicing function of the wild-type insert. (C) Additional exemplars for clusters 30 and 35, along with exemplars for clusters 8 and 17 were used to contrast the effect of predicted neutral mutations (M1) or the effect of predicted change-of-function mutations (M2) with wild-type splicing. As before, the M2 mutation is the variation with the highest intraallelic L1 distance, and the negative control, the M1 mutation, has the lowest intraallelic L1 distance.

