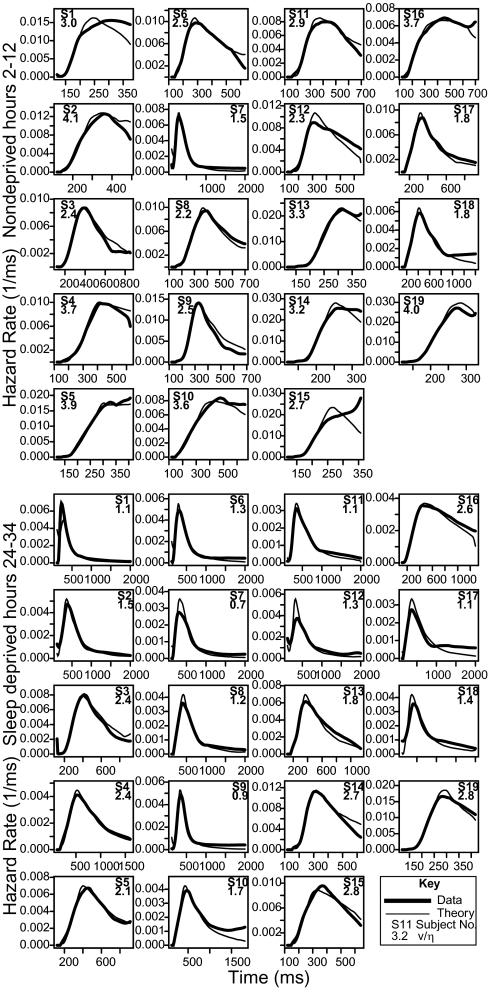
Fig. 3.
Hazard functions for individual subjects’ data from experiment 2 (narrow lines) and predicted hazard functions from fits of the one-choice diffusion model (thick lines) for sleep-deprived and nondeprived conditions. The legend in each figure shows the subject number, as well as the model-derived ratio of mean drift rate to SD in drift rate (v/η). The latter provides an index of the length of the right tail of the RT distribution.

