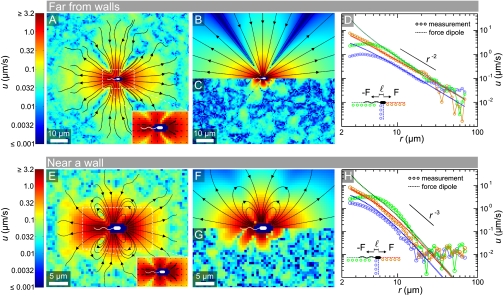
Fig. 1.
Average flow field created by a single freely swimming bacterium far from surfaces (A–D) and close to a wall (E–H). Streamlines indicate the local direction of flow, and the logarithmic color scheme indicates flow speed magnitudes. (A) Experimentally measured flow field in the bacterial swimming plane, with the inset showing the anterior-posterior asymmetry close to the cell body. (B) Best-fit force dipole flow. (C) Residual flow field, obtained by subtracting the best-fit dipole model from the measured field. (D) Radial decay of the flow speed u in different directions, with r = 0 corresponding to the center of the cell body. For distances r ≲ 6 μm the dipole model overestimates the flow field behind and to the side of the cell body. (E) Experimentally measured flow field in the bacterial swimming plane, for bacteria swimming parallel to a wall at a distance of 2 μm. (F) Best-fit force dipole flow, where the presence of the wall causes inward and outward streamlines to join. (G) Residual flow field. (H) The flow speed decays much faster for bacteria swimming close to a wall, as the fluid velocity must vanish on the surface.

