Fig. 4.
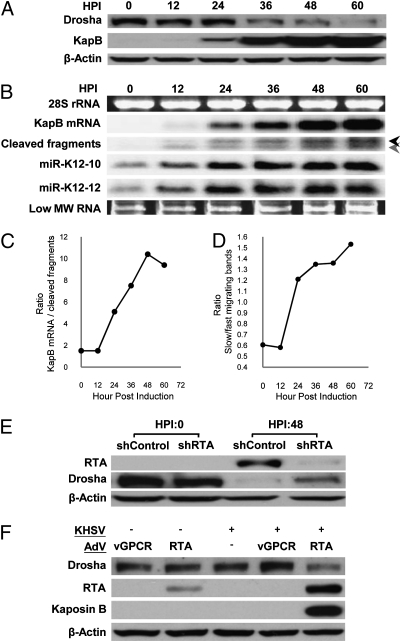
Lytic infection induces decreases in Drosha levels resulting in decreased cis-regulation of KapB transcripts. (A) KSHV lytic infection leads to down-regulation of Drosha protein levels in TREx-RTA BCBL-1 cells. HPI, hours post induction of lytic replication. (B and C) Northern blot analysis demonstrates differences in the kinetics of accumulation of Drosha substrates and products in TREx-RTA BCBL-1 cells at various times postinduction of lytic replication. (B) Full-length KapB mRNA shows robust increases starting at 24 HPI, whereas Drosha substrates (cleaved fragments and miRs K12-10 and K12-12) start accumulating as early as 12 HPI, but the degree of increase slows as Drosha levels diminish. The black arrow indicates the fragment generated by cleavage of premiR K12-10. The gray arrow indicates the products of transcripts cleaved at either premiR K12-12 alone, or at both premiR K12-12 and premiR K12-10 (see Fig. S1 for a detailed diagram). (C) The ratio of full-length KapB mRNA:KapB mRNA cleavage fragments changes during the course of lytic infection, demonstrating Drosha-mediated cleavage plays a greater regulatory role of KapB expression levels during latent infection. Shown is a representative plot of multiple independent experiments (similar to B) showing the ratio of full-length KapB mRNA:KapB mRNA cleavage fragments. (D) The ratio of fast:slow migrating cleavage fragments inverts during the course of lytic infection demonstrating decreased Drosha activity and that premiR K12-10 is a preferred Drosha substrate over premiR K12-12. Shown is a representative plot of multiple independent experiments (similar to B). (E and F) Independent models of KSHV lytic replication decrease Drosha levels. (E) To ensure lytic replication (and not the drug regimen used to induce PEL B cells into lytic replication) is responsible for the decreases in Drosha levels, lytic-inducing drugs were added to TREx-RTA BCBL-1 cells transfected with an shRNA that knocks down RTA (the lytic switch protein whose expression is necessary and sufficient for lytic induction). Immunoblot analysis shows that partial knockdown of RTA results in increased Drosha levels. β-Actin levels are shown as a loading control. (F) KSHV de novo lytic infection of primary endothelial cells (HUVECs) results in decreased Drosha levels. “+” Indicates KSHV virus was added. Superinfection with an RTA-expressing adenoviral vector was used to induce lytic replication. An adenoviral vector expressing the viral protein vGPCR (which is not sufficient to induce lytic replication) was included as a negative control. Only coinfection with KSHV and the Ad-RTA vector negatively regulates Drosha levels. We note that double infection with Ad-RTA and KSHV results in increased levels of RTA over Ad-RTA infection alone. This finding is consistent with the previously characterized RTA autoregulation of its own promoter (31).

