Fig. 5.
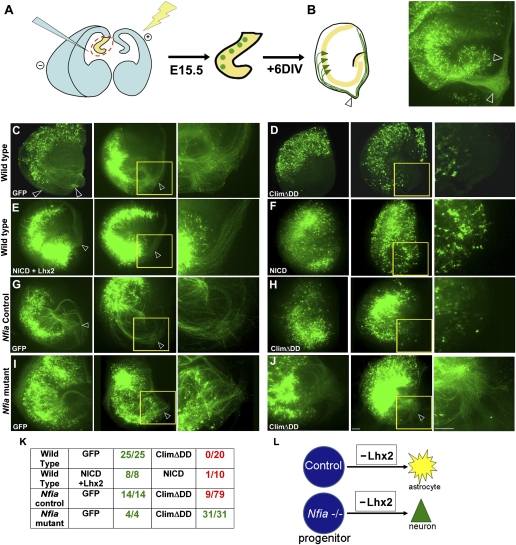
In vitro organotypic explant culture system recapitulates the in utero electroporation findings and reveals interaction between Nfia and ClimΔDD in hippocampal astrogliogenesis. (A) Schematic of ex vivo electroporation and explant culture. After electroporation is performed in the intact brain, sections are prepared that contain electroporated progenitors (green circles). (B) After 6 d in vitro, the explants display GFP-expressing pyramidal neurons (green triangles) residing within the pyramidal cell layer (yellow) and extending axons (green) that encircle the periphery of the explant. A control explant electroporated with GFP is displayed alongside the schematic. Open arrowheads mark the fimbria and encircling axons. DIV, days in vitro. (C) Organotypic explant cultures prepared at E15, electroporated with a control (GFP) construct and examined 6 d later (+6 DIV) display robust axon bundles. Electroporation of either ClimΔDD (D) or NICD (F) switches the electroporated cells to an astrocytic fate, and axon bundles are no longer detectable. (E) Coelectroporation of Lhx2-GFP together with NICD rescues neurogenesis and produces a phenotype indistinguishable from control GFP electroporations (compare C and E). (G–J) E15 littermate embryos from Nfia+/− matings were used. Control (G) and mutant (I) explants electroporated with a GFP construct display numerous axons after 6 DIV, indicating proper differentiation of the pyramidal cells in the presence as well as absence of Nfia. (H) Electroporation of ClimΔDD-GFP in control explants produces GFP-expressing cells that do not produce axons in most of the explants. This is consistent with the astrogliogenic effect of ClimΔDD in WT brains shown in D. (J) In contrast, ClimΔDD-GFP electroporation into Nfia−/− explants produces explants with robust axonal growth, indicating that ClimΔDD is not able to induce astrogliogenesis in the absence of functional Nfia. (K) Tabulated results of the experiments shown in C–J. The number of explants with detectable axons was scored. (L) Diagram summarizing the results. In C–J, the region of the fimbria (yellow box) in one of the two explants is shown at higher magnification alongside. (Scale bars: 100 μm.) E (first image) and F (second image) are composites assembled from two epifluoresence images.

